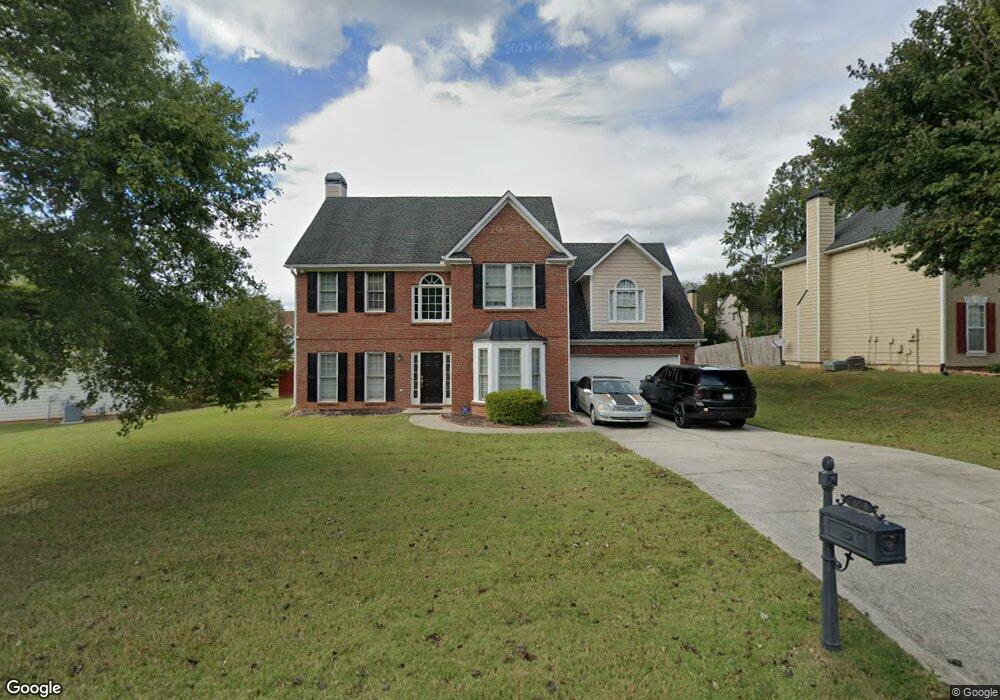
7458 Crescent Bend Cove Unit 8/802 Stone Mountain, GA 30087
Estimated Value: $328,000 - $357,000
4
Beds
3
Baths
2,516
Sq Ft
$135/Sq Ft
Est. Value
About This Home
This home is located at 7458 Crescent Bend Cove Unit 8/802, Stone Mountain, GA 30087 and is currently estimated at $338,858, approximately $134 per square foot. 7458 Crescent Bend Cove Unit 8/802 is a home located in DeKalb County with nearby schools including Princeton Elementary School, Stephenson Middle School, and Stephenson High School.
Ownership History
Date
Name
Owned For
Owner Type
Purchase Details
Closed on
Mar 12, 2021
Sold by
Henley Ruth
Bought by
Mohamed Redwan A
Current Estimated Value
Home Financials for this Owner
Home Financials are based on the most recent Mortgage that was taken out on this home.
Original Mortgage
$200,175
Outstanding Balance
$179,127
Interest Rate
2.73%
Mortgage Type
New Conventional
Estimated Equity
$159,731
Purchase Details
Closed on
Nov 8, 2010
Sold by
Federal Natl Mtg Assn Fnma
Bought by
Henley Ruth
Purchase Details
Closed on
Apr 6, 2010
Sold by
Citimortgage Inc
Bought by
Federal Natle Mtg Assn Fnma
Purchase Details
Closed on
Jul 26, 2001
Sold by
Hall William F
Bought by
Freeman Leah M
Purchase Details
Closed on
Jul 6, 2001
Sold by
Hall Leah M
Bought by
Freeman Leah M
Purchase Details
Closed on
Feb 21, 2000
Sold by
Hall Jr William F
Bought by
Hall Jr Leah M and Hall Jr William F
Purchase Details
Closed on
Oct 18, 1996
Sold by
Arvida Jmb Partners Lp
Bought by
Hall William
Create a Home Valuation Report for This Property
The Home Valuation Report is an in-depth analysis detailing your home's value as well as a comparison with similar homes in the area
Home Values in the Area
Average Home Value in this Area
Purchase History
| Date | Buyer | Sale Price | Title Company |
|---|---|---|---|
| Mohamed Redwan A | $235,500 | -- | |
| Henley Ruth | $117,000 | -- | |
| Federal Natle Mtg Assn Fnma | -- | -- | |
| Citimortgage Inc | $201,444 | -- | |
| Freeman Leah M | -- | -- | |
| Freeman Leah M | -- | -- | |
| Hall Jr Leah M | -- | -- | |
| Hall William | $152,900 | -- |
Source: Public Records
Mortgage History
| Date | Status | Borrower | Loan Amount |
|---|---|---|---|
| Open | Mohamed Redwan A | $200,175 | |
| Closed | Hall William | $0 |
Source: Public Records
Tax History Compared to Growth
Tax History
| Year | Tax Paid | Tax Assessment Tax Assessment Total Assessment is a certain percentage of the fair market value that is determined by local assessors to be the total taxable value of land and additions on the property. | Land | Improvement |
|---|---|---|---|---|
| 2025 | $4,548 | $138,760 | $18,039 | $120,721 |
| 2024 | $4,761 | $138,760 | $18,039 | $120,721 |
| 2023 | $4,761 | $138,760 | $18,040 | $120,720 |
| 2022 | $4,500 | $94,200 | $15,080 | $79,120 |
| 2021 | $4,302 | $89,680 | $18,040 | $71,640 |
| 2020 | $3,863 | $79,680 | $18,040 | $61,640 |
| 2019 | $3,354 | $68,080 | $18,040 | $50,040 |
| 2018 | $2,753 | $68,080 | $18,040 | $50,040 |
| 2017 | $3,367 | $68,080 | $18,040 | $50,040 |
| 2016 | $2,130 | $39,920 | $18,040 | $21,880 |
| 2014 | $2,552 | $48,280 | $18,000 | $30,280 |
Source: Public Records
Map
Nearby Homes
- 672 Stonebridge Loop
- 596 Watson Cove
- 7536 Stonebridge Bay Ct
- 731 Bridgewood Ct
- 728 Stonebridge Crescent
- 7593 Watson Bay Ct
- 731 Stonebridge Park Cir
- 7592 Watson Kaye
- 734 Stonebridge Park Cir
- 7606 Watson Kaye
- 751 Stonebridge Park Cir
- 757 Stonebridge Park Cir
- 7249 Misty Harbor Ct
- 775 Edenberry Ln Unit 1
- 776 Edenberry Ln
- 7550 Waters Edge Dr
- 854 Asbury Trail
- 872 Asbury Trail
- 857 Asbury Trail
- 829 Carlingford Place
- 7458 Crescent Bend Cove Unit 802
- 7458 Crescent Bend Cove
- 7458 Crescent Bend Cove Unit 8
- 7446 Crescent Bend Cove
- 7466 Crescent Bend Cove Unit VIII
- 407 Watson Bay Unit 7
- 401 Watson Bay
- 7472 Crescent Bend Cove Unit 8
- 7471 Clipper Cove
- 413 Watson Bay Unit 7
- 395 Watson Bay
- 7459 Crescent Bend Cove
- 7459 Crescent Bend Cove Unit 4/822
- 7445 Crescent Bend Cove
- 7455 Crescent Bend Cove
- 7441 Crescent Bend Cove
- 7478 Crescent Bend Cove Unit 8
- 7451 Crescent Bend Cove
- 421 Watson Bay Unit VII
- 427 Watson Bay