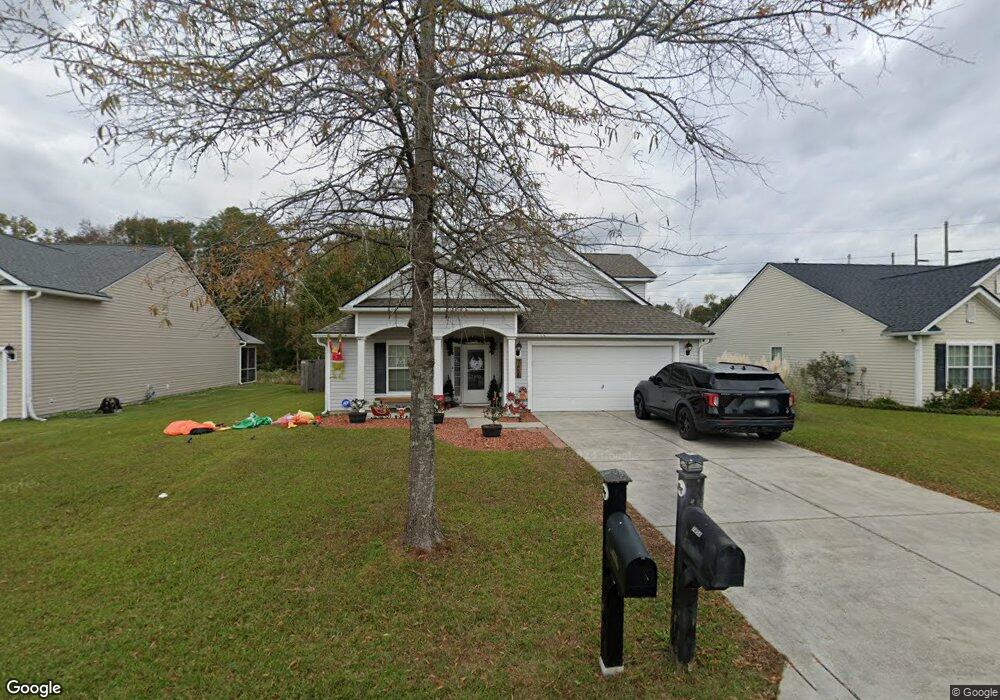
7458 Painted Bunting Way Hanahan, SC 29410
Estimated Value: $459,221 - $509,000
4
Beds
2
Baths
2,060
Sq Ft
$234/Sq Ft
Est. Value
About This Home
This home is located at 7458 Painted Bunting Way, Hanahan, SC 29410 and is currently estimated at $482,305, approximately $234 per square foot. 7458 Painted Bunting Way is a home located in Berkeley County with nearby schools including Bowen's Corner Elementary, Hanahan Middle School, and Hanahan High School.
Ownership History
Date
Name
Owned For
Owner Type
Purchase Details
Closed on
Apr 4, 2025
Sold by
Shaw Sabra Royle and Shaw Sabra R
Bought by
Living Trust and Shaw
Current Estimated Value
Purchase Details
Closed on
Jul 18, 2014
Sold by
Runyon Scott R and Runyon Dena C
Bought by
Shaw Sabra R
Home Financials for this Owner
Home Financials are based on the most recent Mortgage that was taken out on this home.
Original Mortgage
$157,500
Interest Rate
4.26%
Mortgage Type
Future Advance Clause Open End Mortgage
Purchase Details
Closed on
May 22, 2006
Sold by
The Ryland Group Inc
Bought by
Runyon Scott R and Runyon Dena C
Home Financials for this Owner
Home Financials are based on the most recent Mortgage that was taken out on this home.
Original Mortgage
$41,354
Interest Rate
6.41%
Mortgage Type
Stand Alone Second
Purchase Details
Closed on
Dec 16, 2005
Sold by
Charleston Brown Co Llc
Bought by
The Ryland Group Inc
Create a Home Valuation Report for This Property
The Home Valuation Report is an in-depth analysis detailing your home's value as well as a comparison with similar homes in the area
Home Values in the Area
Average Home Value in this Area
Purchase History
| Date | Buyer | Sale Price | Title Company |
|---|---|---|---|
| Living Trust | -- | None Listed On Document | |
| Living Trust | -- | None Listed On Document | |
| Shaw Sabra R | $232,600 | -- | |
| Runyon Scott R | $206,770 | None Available | |
| The Ryland Group Inc | $410,597 | None Available |
Source: Public Records
Mortgage History
| Date | Status | Borrower | Loan Amount |
|---|---|---|---|
| Previous Owner | Shaw Sabra R | $157,500 | |
| Previous Owner | Runyon Scott R | $41,354 |
Source: Public Records
Tax History Compared to Growth
Tax History
| Year | Tax Paid | Tax Assessment Tax Assessment Total Assessment is a certain percentage of the fair market value that is determined by local assessors to be the total taxable value of land and additions on the property. | Land | Improvement |
|---|---|---|---|---|
| 2025 | $1,703 | $304,969 | $61,034 | $243,935 |
| 2024 | $1,703 | $12,198 | $2,441 | $9,757 |
| 2023 | $1,703 | $12,198 | $2,441 | $9,757 |
| 2022 | $1,660 | $10,607 | $1,946 | $8,661 |
| 2021 | $1,562 | $10,610 | $1,946 | $8,661 |
| 2020 | $1,470 | $10,607 | $1,946 | $8,661 |
| 2019 | $1,526 | $10,607 | $1,946 | $8,661 |
| 2018 | $1,403 | $9,224 | $1,840 | $7,384 |
| 2017 | $1,373 | $9,224 | $1,840 | $7,384 |
| 2016 | $1,342 | $9,220 | $1,840 | $7,380 |
| 2015 | $1,178 | $8,820 | $1,840 | $6,980 |
| 2014 | $2,066 | $7,810 | $1,840 | $5,970 |
| 2013 | -- | $7,810 | $1,840 | $5,970 |
Source: Public Records
Map
Nearby Homes
- 1333 Song Sparrow Way
- 7402 Purser Ln
- 1038 Old Cypress Run
- 7406 Mercedes Way
- 7434 Northgate Dr
- 7326 Kestrel Trail
- 7315 Kestrel Trail
- 7303 Kestrel Trail
- 7532 Hawks Cir
- 7304 Kestrel Trail
- 7317 Horned Grebe Ct
- 7358 Suncatcher Dr
- 7316 Water Thrush Ct
- 7316 Stoney Moss Way
- 202 Waterwood Dr Unit 2302
- 605 Waterwood Dr Unit 1505
- 607 Waterwood Dr
- 201 Greenmeadow Dr
- 202 Greenmeadow Dr
- 1005 Waterwood Dr
- 7460 Painted Bunting Way
- 7456 Painted Bunting Way
- 7462 Painted Bunting Way
- 7454 Painted Bunting Way
- 7461 Painted Bunting Way
- 7463 Painted Bunting Way
- 7459 Painted Bunting Way
- 7464 Painted Bunting Way
- 7465 Painted Bunting Way
- 7452 Painted Bunting Way
- 7457 Painted Bunting Way
- 7528 Whispering Oak Dr
- 7466 Painted Bunting Way
- 7526 Whispering Oak Dr
- 7467 Painted Bunting Way
- 1407 Grackle Ct
- 1405 Grackle Ct
- 7453 Painted Bunting Way
- 7524 Whispering Oak Dr
- 7450 Painted Bunting Way