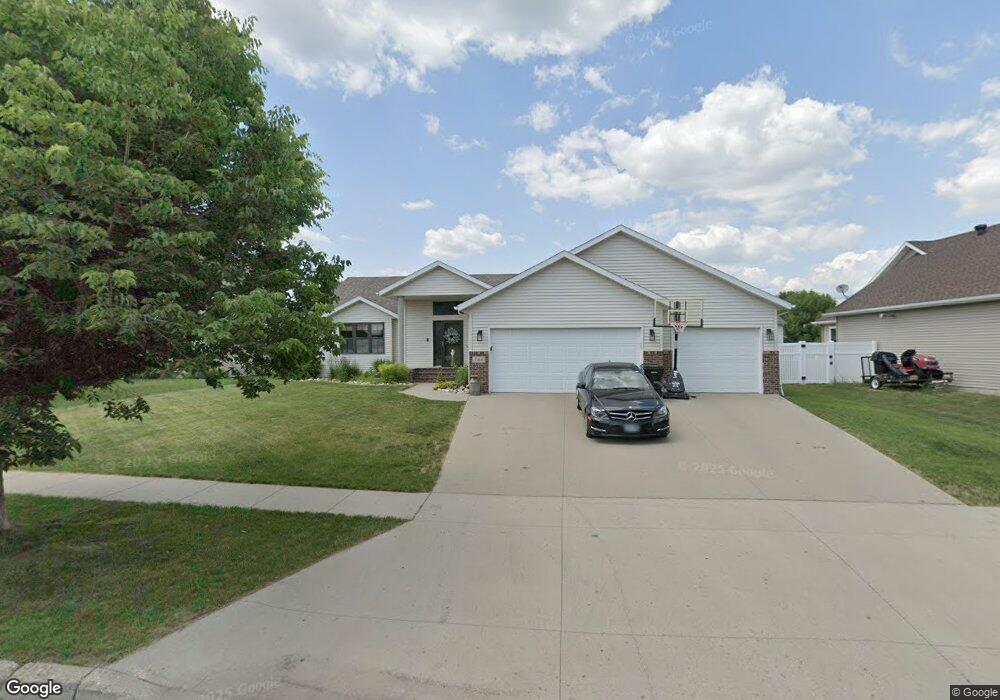
746 17th Ave E West Fargo, ND 58078
Charleswood NeighborhoodEstimated Value: $443,000 - $522,490
3
Beds
2
Baths
1,550
Sq Ft
$311/Sq Ft
Est. Value
About This Home
This home is located at 746 17th Ave E, West Fargo, ND 58078 and is currently estimated at $482,745, approximately $311 per square foot. 746 17th Ave E is a home located in Cass County with nearby schools including South Elementary School, Cheney Middle School, and West Fargo High School.
Ownership History
Date
Name
Owned For
Owner Type
Purchase Details
Closed on
Jan 9, 2018
Sold by
Byers Richard
Bought by
Byers Sumer
Current Estimated Value
Home Financials for this Owner
Home Financials are based on the most recent Mortgage that was taken out on this home.
Original Mortgage
$186,500
Outstanding Balance
$154,521
Interest Rate
3.25%
Mortgage Type
Adjustable Rate Mortgage/ARM
Estimated Equity
$328,224
Purchase Details
Closed on
May 16, 2008
Sold by
Heritage Homes Llc
Bought by
Byers Richard and Byers Sumer
Home Financials for this Owner
Home Financials are based on the most recent Mortgage that was taken out on this home.
Original Mortgage
$186,720
Interest Rate
5.93%
Mortgage Type
New Conventional
Purchase Details
Closed on
Sep 19, 2007
Sold by
Charleswood Inc
Bought by
Heritage Homes Llc
Home Financials for this Owner
Home Financials are based on the most recent Mortgage that was taken out on this home.
Original Mortgage
$172,350
Interest Rate
6.33%
Mortgage Type
Construction
Create a Home Valuation Report for This Property
The Home Valuation Report is an in-depth analysis detailing your home's value as well as a comparison with similar homes in the area
Home Values in the Area
Average Home Value in this Area
Purchase History
| Date | Buyer | Sale Price | Title Company |
|---|---|---|---|
| Byers Sumer | -- | Title Co | |
| Byers Richard | -- | -- | |
| Heritage Homes Llc | -- | -- |
Source: Public Records
Mortgage History
| Date | Status | Borrower | Loan Amount |
|---|---|---|---|
| Open | Byers Sumer | $186,500 | |
| Closed | Byers Richard | $186,720 | |
| Previous Owner | Heritage Homes Llc | $172,350 |
Source: Public Records
Tax History
| Year | Tax Paid | Tax Assessment Tax Assessment Total Assessment is a certain percentage of the fair market value that is determined by local assessors to be the total taxable value of land and additions on the property. | Land | Improvement |
|---|---|---|---|---|
| 2024 | $5,205 | $203,850 | $33,800 | $170,050 |
| 2023 | $5,398 | $191,500 | $33,800 | $157,700 |
| 2022 | $5,484 | $187,950 | $33,800 | $154,150 |
| 2021 | $5,091 | $168,000 | $27,850 | $140,150 |
| 2020 | $4,805 | $164,250 | $27,850 | $136,400 |
| 2019 | $4,588 | $162,850 | $27,850 | $135,000 |
| 2018 | $4,401 | $161,500 | $27,850 | $133,650 |
| 2017 | $4,343 | $162,900 | $27,850 | $135,050 |
| 2016 | $3,843 | $158,100 | $27,850 | $130,250 |
| 2015 | $3,564 | $135,400 | $18,200 | $117,200 |
| 2014 | $3,358 | $126,550 | $18,200 | $108,350 |
| 2013 | $3,273 | $121,400 | $18,200 | $103,200 |
Source: Public Records
Map
Nearby Homes
- 715 Northridge Way
- 790 Lakeridge Dr
- 868 Lakeridge Place
- 1811 7th St E
- 1827 7th St E
- 783 14 1 2 Ave E
- 1929 Pentland St
- 714 14th Ave E
- 706 14th Ave E
- 1829 13th St E
- 1884 Huntington Ln
- 1424 14th St E Unit 11
- 602 12 1 2 Ave E Unit 5
- 332 13th Ave E
- 1814 Brentwood Ct
- 245 12th Ave E
- 118 W Beaton Dr
- 622 12th Ave E
- 1550 Sheyenne St
- 1842 52nd St S
- 752 17th Ave E
- 740 17th Ave E
- 729 Wyndemere Dr
- 733 Wyndemere Dr
- 758 17 Ave E
- 758 17th Ave E
- 725 Wyndemere Dr
- 734 17th Ave E
- 737 Wyndemere Dr
- 721 Wyndemere Dr
- 728 17th Ave E
- 1713 Evergreen Way
- 1710 Evergreen Way
- 1716 Cypress Way
- 1703 Cypress Way
- 745 Wyndemere Dr
- 713 Wyndemere Dr
- 726 Wyndemere Dr
- 1714 Evergreen Way
- 722 17th Ave E
Your Personal Tour Guide
Ask me questions while you tour the home.