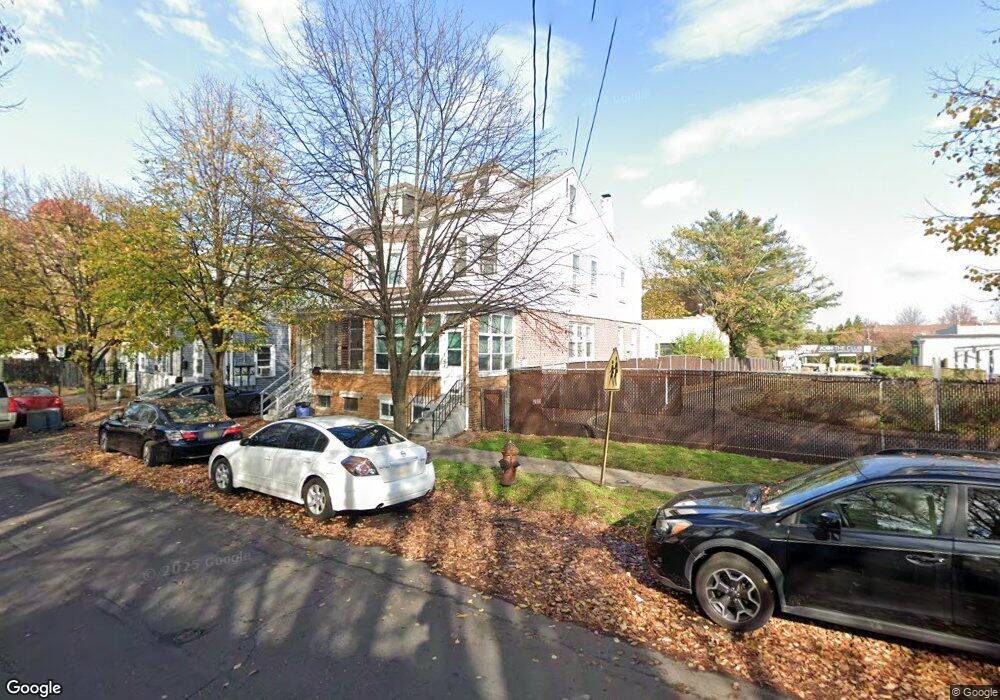
746 2nd St Trenton, NJ 08611
South Trenton NeighborhoodEstimated Value: $141,081 - $216,000
--
Bed
--
Bath
1,300
Sq Ft
$146/Sq Ft
Est. Value
About This Home
This home is located at 746 2nd St, Trenton, NJ 08611 and is currently estimated at $189,270, approximately $145 per square foot. 746 2nd St is a home located in Mercer County with nearby schools including Mott Elementary School, Parker Elementary School, and Grace A Dunn Middle School.
Ownership History
Date
Name
Owned For
Owner Type
Purchase Details
Closed on
Apr 22, 2005
Current Estimated Value
Create a Home Valuation Report for This Property
The Home Valuation Report is an in-depth analysis detailing your home's value as well as a comparison with similar homes in the area
Home Values in the Area
Average Home Value in this Area
Purchase History
| Date | Buyer | Sale Price | Title Company |
|---|---|---|---|
| -- | -- | -- |
Source: Public Records
Tax History Compared to Growth
Tax History
| Year | Tax Paid | Tax Assessment Tax Assessment Total Assessment is a certain percentage of the fair market value that is determined by local assessors to be the total taxable value of land and additions on the property. | Land | Improvement |
|---|---|---|---|---|
| 2025 | $3,347 | $57,700 | $7,600 | $50,100 |
| 2024 | $3,212 | $57,700 | $7,600 | $50,100 |
| 2023 | $3,212 | $57,700 | $7,600 | $50,100 |
| 2022 | $3,149 | $57,700 | $7,600 | $50,100 |
| 2021 | $3,204 | $57,700 | $7,600 | $50,100 |
| 2020 | $3,194 | $57,700 | $7,600 | $50,100 |
| 2019 | $3,142 | $57,700 | $7,600 | $50,100 |
| 2018 | $3,008 | $57,700 | $7,600 | $50,100 |
| 2017 | $2,859 | $57,700 | $7,600 | $50,100 |
| 2016 | $3,855 | $67,000 | $12,500 | $54,500 |
| 2015 | $3,841 | $67,000 | $12,500 | $54,500 |
| 2014 | $3,823 | $67,000 | $12,500 | $54,500 |
Source: Public Records
Map
Nearby Homes