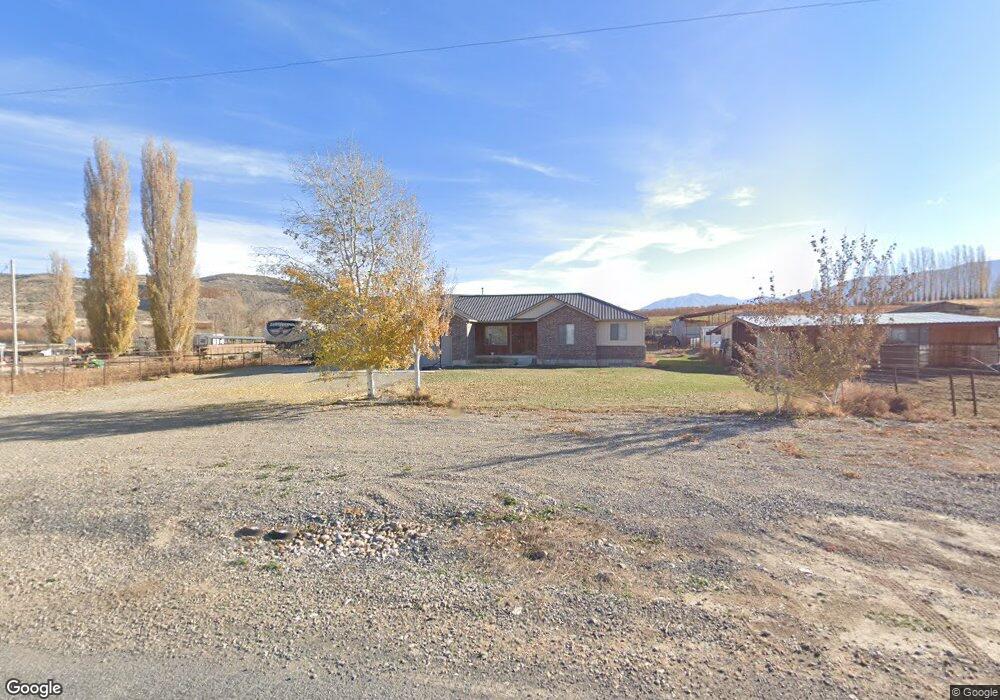
746 N 800 E Genola, UT 84655
Estimated Value: $781,000 - $964,000
3
Beds
4
Baths
1,596
Sq Ft
$553/Sq Ft
Est. Value
About This Home
This home is located at 746 N 800 E, Genola, UT 84655 and is currently estimated at $882,572, approximately $552 per square foot. 746 N 800 E is a home with nearby schools including Goshen Elementary school, Payson Junior High School, and Mt. Nebo Middle.
Ownership History
Date
Name
Owned For
Owner Type
Purchase Details
Closed on
Mar 27, 2020
Sold by
Draper Colby and Draper Nicole
Bought by
Draper Colby and Draper Nicole
Current Estimated Value
Home Financials for this Owner
Home Financials are based on the most recent Mortgage that was taken out on this home.
Original Mortgage
$200,000
Interest Rate
3.4%
Mortgage Type
New Conventional
Purchase Details
Closed on
Nov 18, 2010
Sold by
Draper Lee Morley and Draper Deborah Ann
Bought by
Draper Colby and Draper Nicole
Home Financials for this Owner
Home Financials are based on the most recent Mortgage that was taken out on this home.
Original Mortgage
$220,000
Interest Rate
4.23%
Mortgage Type
Construction
Purchase Details
Closed on
Sep 16, 2010
Sold by
Draper Lee
Bought by
Draper Colby
Create a Home Valuation Report for This Property
The Home Valuation Report is an in-depth analysis detailing your home's value as well as a comparison with similar homes in the area
Purchase History
| Date | Buyer | Sale Price | Title Company |
|---|---|---|---|
| Draper Colby | -- | Acco | |
| Draper Colby | -- | Us Title Insurance Agency | |
| Draper Colby | -- | Signature Title Insurance A | |
| Draper Colby | -- | None Available |
Source: Public Records
Mortgage History
| Date | Status | Borrower | Loan Amount |
|---|---|---|---|
| Closed | Draper Colby | $200,000 | |
| Closed | Draper Colby | $220,000 |
Source: Public Records
Tax History
| Year | Tax Paid | Tax Assessment Tax Assessment Total Assessment is a certain percentage of the fair market value that is determined by local assessors to be the total taxable value of land and additions on the property. | Land | Improvement |
|---|---|---|---|---|
| 2025 | $3,431 | $405,060 | -- | -- |
| 2024 | $3,431 | $354,855 | $0 | $0 |
| 2023 | $3,451 | $357,605 | $0 | $0 |
| 2022 | $3,742 | $660,400 | $281,500 | $378,900 |
| 2021 | $3,267 | $506,100 | $195,800 | $310,300 |
| 2020 | $3,125 | $471,600 | $170,300 | $301,300 |
| 2019 | $2,661 | $412,300 | $147,100 | $265,200 |
| 2018 | $2,604 | $387,300 | $132,100 | $255,200 |
| 2017 | $2,421 | $206,680 | $0 | $0 |
| 2016 | $2,247 | $192,930 | $0 | $0 |
| 2015 | $2,240 | $190,180 | $0 | $0 |
| 2014 | $2,230 | $190,180 | $0 | $0 |
Source: Public Records
Map
Nearby Homes
- 1220 N Hillside Dr
- 956 N Main St
- 11508 S 5825 W
- 975 E 715 S
- 5746 W 11300 S
- 5635 W 11300 S
- 11433 S 5600 W
- 893 N 260 W Unit 227
- 11363 S 5600 West St
- 892 N 260 W Unit 202
- 214 W 930 N
- 210 W 930 N
- 206 W 930 N
- 969 N Apple Seed Ln
- 71 W 860 N
- 112 W 770 N
- 716 W Empress St Unit 12
- 712 W Empress St Unit 14
- 712 W Empress St Unit 13
- 704 Empress St Unit 15
Your Personal Tour Guide
Ask me questions while you tour the home.