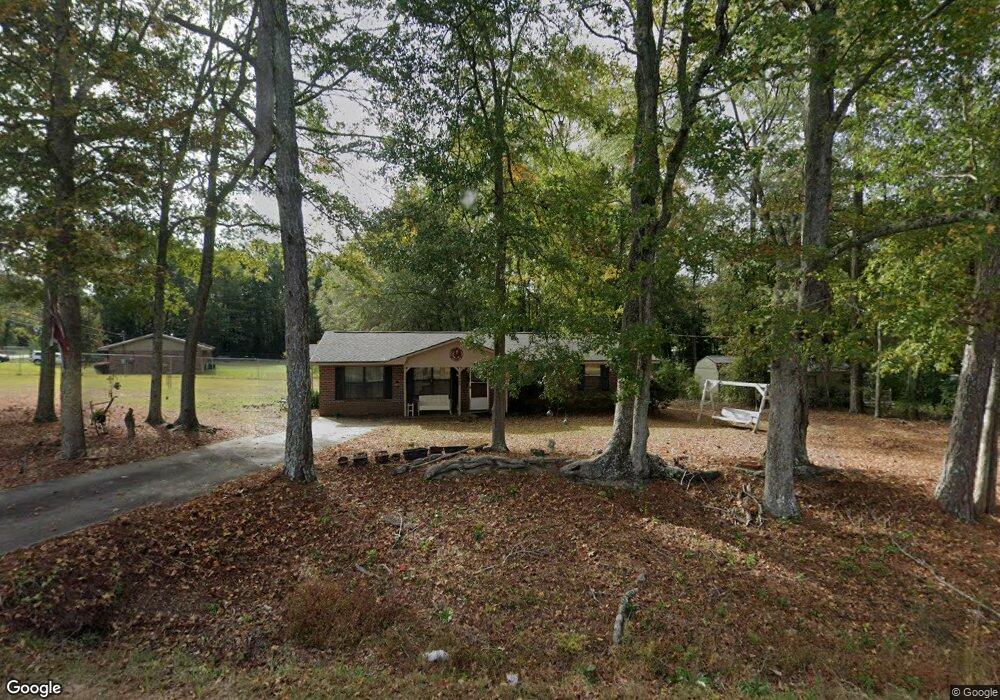
7460 Kings Gap Rd Shiloh, GA 31826
Estimated Value: $122,000 - $179,261
3
Beds
2
Baths
1,565
Sq Ft
$93/Sq Ft
Est. Value
About This Home
This home is located at 7460 Kings Gap Rd, Shiloh, GA 31826 and is currently estimated at $145,565, approximately $93 per square foot. 7460 Kings Gap Rd is a home located in Harris County with nearby schools including Park Elementary School, Harris County Carver Middle School, and Creekside School.
Ownership History
Date
Name
Owned For
Owner Type
Purchase Details
Closed on
Jun 18, 2018
Sold by
Robinson James A
Bought by
Robinson James A and Robinson Stephanie Lynn
Current Estimated Value
Purchase Details
Closed on
Jul 9, 2013
Sold by
Federal Home Loan Mortgage Corporation
Bought by
Robinson James A
Home Financials for this Owner
Home Financials are based on the most recent Mortgage that was taken out on this home.
Original Mortgage
$49,440
Interest Rate
4%
Mortgage Type
New Conventional
Purchase Details
Closed on
Feb 5, 2013
Sold by
Wells Fargo Bank
Bought by
Federal Home Loan Mortgage Corporation
Purchase Details
Closed on
Oct 10, 2006
Sold by
Daniel Carolyn S
Bought by
Boone Teresa L
Purchase Details
Closed on
Nov 24, 2004
Sold by
Jackson Matilda
Bought by
Daniel Carolyn S
Purchase Details
Closed on
Aug 20, 1990
Bought by
Jackson Matilda
Create a Home Valuation Report for This Property
The Home Valuation Report is an in-depth analysis detailing your home's value as well as a comparison with similar homes in the area
Purchase History
| Date | Buyer | Sale Price | Title Company |
|---|---|---|---|
| Robinson James A | -- | -- | |
| Robinson James A | -- | -- | |
| Federal Home Loan Mortgage Corporation | $81,718 | -- | |
| Wells Fargo Bank | $81,718 | -- | |
| Boone Teresa L | -- | -- | |
| Daniel Carolyn S | $71,000 | -- | |
| Jackson Matilda | $3,000 | -- |
Source: Public Records
Mortgage History
| Date | Status | Borrower | Loan Amount |
|---|---|---|---|
| Previous Owner | Robinson James A | $49,440 |
Source: Public Records
Tax History
| Year | Tax Paid | Tax Assessment Tax Assessment Total Assessment is a certain percentage of the fair market value that is determined by local assessors to be the total taxable value of land and additions on the property. | Land | Improvement |
|---|---|---|---|---|
| 2025 | $1,607 | $50,879 | $4,400 | $46,479 |
| 2024 | $1,486 | $44,815 | $4,400 | $40,415 |
| 2023 | $1,483 | $44,713 | $4,400 | $40,313 |
| 2022 | $1,237 | $44,713 | $4,400 | $40,313 |
| 2021 | $1,147 | $39,967 | $4,400 | $35,567 |
| 2020 | $1,147 | $39,967 | $4,400 | $35,567 |
| 2019 | $1,107 | $39,967 | $4,400 | $35,567 |
| 2018 | $834 | $29,101 | $4,400 | $24,701 |
| 2017 | $834 | $29,101 | $4,400 | $24,701 |
| 2016 | $751 | $28,268 | $4,400 | $23,868 |
| 2015 | $752 | $28,268 | $4,400 | $23,868 |
| 2014 | $754 | $28,268 | $4,400 | $23,868 |
| 2013 | -- | $28,267 | $4,400 | $23,867 |
Source: Public Records
Map
Nearby Homes
- 2.83 ACRES Williams Rd
- 21401 Ga Highway 116
- 5920 Kings Gap Rd
- 17081 Ga Highway 85 W
- 19110 Ga Highway 116
- Nebula Rd
- 1540 Flint Hill Hwy
- Tract 2 - 0 Saint Paul Church Rd
- 909 Weeding Cherry Dr
- 00Lot3 & Lot 4 Mountain Ridge Dr
- LOT 1 & LOT 15 Mountain Ridge Dr
- LOT 19 Mountain Ridge Dr
- 1755 Hunsinger Rd
- 2385 Nebula Rd
- 0 Oak Mountain Rd Unit 230706
- BLK 38 LOT 02 Violet Ln
- BLK 34 LOT 6 Juniper Way
- BLK 33 LOT 06 Juniper Way
- 2450 Chestnut Grove Rd Unit 2
- 2450 Chestnut Grove Rd
- 1393 N Main St
- 1441 N Main St
- 1369 N Main St
- 1390 N Main St
- 470 1st St
- 7415 Kings Gap Rd
- 1479 N Main St
- 28 Rose St
- 1512 N Main St
- 510 2nd Ave
- 1505 N Main St
- 311 Elm Dr
- 27 Williams Rd
- 19 Williams Lane Rd
- 1533 N Main St
- 249 Elm St
- 1277 N Main St
- 7318 Kings Gap Rd
- 7318 Kings Gap Rd Unit 1
- 49 Williams Rd
Your Personal Tour Guide
Ask me questions while you tour the home.