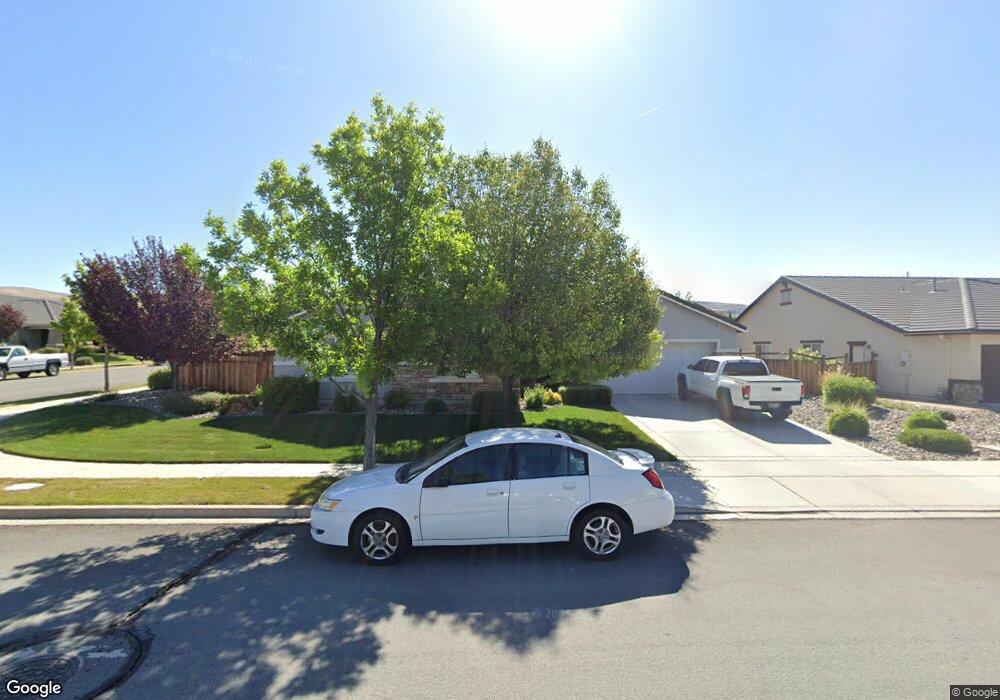
7464 Phoenix Dr Sparks, NV 89436
Wingfield Springs NeighborhoodEstimated Value: $693,262 - $774,000
4
Beds
3
Baths
2,547
Sq Ft
$289/Sq Ft
Est. Value
About This Home
This home is located at 7464 Phoenix Dr, Sparks, NV 89436 and is currently estimated at $736,066, approximately $288 per square foot. 7464 Phoenix Dr is a home with nearby schools including Spanish Springs Elementary School, Yvonne Shaw Middle School, and Spanish Springs High School.
Ownership History
Date
Name
Owned For
Owner Type
Purchase Details
Closed on
Jan 17, 2014
Sold by
Edmunds Edwin Jarrod
Bought by
Edmunds Edwin Jarrod and Edmunds Tina
Current Estimated Value
Purchase Details
Closed on
Jan 14, 2014
Sold by
Edmunds Tina
Bought by
Edmunds Edwin Jarrod
Purchase Details
Closed on
Sep 12, 2013
Sold by
Lennar Reno Llc
Bought by
Edmunds Edwin Jarrod
Home Financials for this Owner
Home Financials are based on the most recent Mortgage that was taken out on this home.
Original Mortgage
$258,761
Interest Rate
4.4%
Mortgage Type
New Conventional
Purchase Details
Closed on
May 4, 2012
Sold by
Wells Fargo Bank National Association
Bought by
Vista Sierra Llc
Purchase Details
Closed on
Dec 26, 2008
Sold by
Reynen & Bardis The Foothills Llc
Bought by
Wells Fargo Bank National Association
Create a Home Valuation Report for This Property
The Home Valuation Report is an in-depth analysis detailing your home's value as well as a comparison with similar homes in the area
Home Values in the Area
Average Home Value in this Area
Purchase History
| Date | Buyer | Sale Price | Title Company |
|---|---|---|---|
| Edmunds Edwin Jarrod | -- | None Available | |
| Edmunds Edwin Jarrod | -- | North American Title Reno | |
| Edmunds Edwin Jarrod | $334,000 | North American Title Reno | |
| Vista Sierra Llc | $1,824,000 | First American Title Reno | |
| Wells Fargo Bank National Association | $3,110,000 | Ticor Title Reno |
Source: Public Records
Mortgage History
| Date | Status | Borrower | Loan Amount |
|---|---|---|---|
| Previous Owner | Edmunds Edwin Jarrod | $258,761 |
Source: Public Records
Tax History
| Year | Tax Paid | Tax Assessment Tax Assessment Total Assessment is a certain percentage of the fair market value that is determined by local assessors to be the total taxable value of land and additions on the property. | Land | Improvement |
|---|---|---|---|---|
| 2026 | $2,938 | $195,268 | $44,065 | $151,204 |
| 2024 | $4,314 | $191,270 | $37,940 | $153,330 |
| 2023 | $4,313 | $187,665 | $43,295 | $144,370 |
| 2022 | $4,188 | $155,311 | $35,490 | $119,821 |
| 2021 | $4,066 | $147,088 | $28,350 | $118,738 |
| 2020 | $3,946 | $146,309 | $27,860 | $118,449 |
| 2019 | $3,831 | $141,677 | $27,615 | $114,062 |
| 2018 | $3,720 | $131,597 | $20,545 | $111,052 |
| 2017 | $3,612 | $129,775 | $18,935 | $110,840 |
| 2016 | $3,520 | $122,994 | $17,185 | $105,809 |
| 2015 | $3,407 | $112,149 | $17,150 | $94,999 |
| 2014 | $3,301 | $92,172 | $13,265 | $78,907 |
| 2013 | -- | $5,486 | $5,390 | $96 |
Source: Public Records
Map
Nearby Homes
- 7423 Comet Ct
- 7354 Phoenix Dr
- 7483 Europa Dr
- 7337 Phoenix Dr
- 7220 Windswept Loop
- 7214 Windswept Loop
- 7657 Bareback Dr
- 3716 Early Dawn Dr
- 7260 Treeline Ct
- 7717 Sonic Ct
- 8495 Eaglenest Rd
- 7707 Rhythm Cir
- 8570 Eaglenest Rd
- 7074 Cinder Village Dr
- 7663 La Ramba Dr
- 7058 Cinder Village Dr
- 3644 Desert Fox Dr
- 4541 Silian Ct
- 7045 Krug Dr
- 3935 Hazy Swale Way
- 7450 Phoenix Dr
- 7469 Star Vista Dr
- 7453 Star Vista Dr
- 3982 Wisdom Dr
- 7434 Phoenix Dr
- 7469 Phoenix Dr
- 3998 Wisdom Dr
- 3966 Wisdom Dr
- 7453 Phoenix Dr
- 4014 Wisdom Dr
- 7437 Phoenix Dr
- 7437 Not Supplied Dr
- 7414 Phoenix Dr
- 3950 Wisdom Dr
- 4030 Wisdom Dr
- 7421 Phoenix Dr
- 3934 Wisdom Dr
- 7464 Star Vista Dr
- 7400 Phoenix Dr
- 7421 Star Vista Dr
Your Personal Tour Guide
Ask me questions while you tour the home.