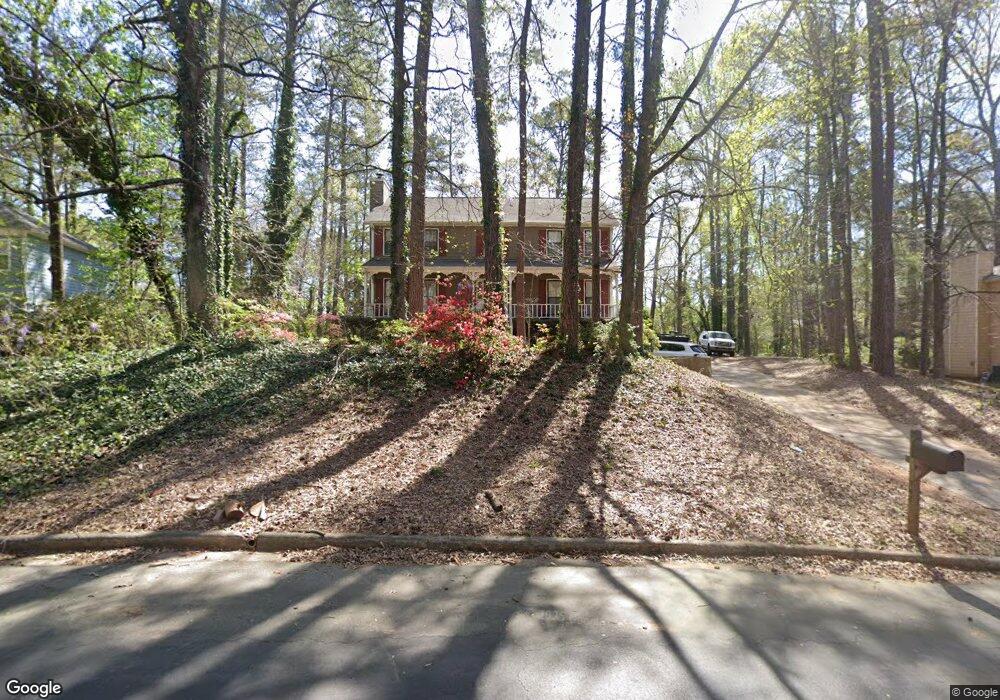
7467 Saybrook Trail Jonesboro, GA 30236
Estimated Value: $277,243 - $365,000
4
Beds
3
Baths
2,420
Sq Ft
$131/Sq Ft
Est. Value
About This Home
This home is located at 7467 Saybrook Trail, Jonesboro, GA 30236 and is currently estimated at $318,061, approximately $131 per square foot. 7467 Saybrook Trail is a home located in Clayton County with nearby schools including James Jackson Elementary School, Jonesboro Middle School, and Jonesboro High School.
Ownership History
Date
Name
Owned For
Owner Type
Purchase Details
Closed on
Mar 23, 2017
Sold by
Black Crystal
Bought by
Mills Crystal Black
Current Estimated Value
Home Financials for this Owner
Home Financials are based on the most recent Mortgage that was taken out on this home.
Original Mortgage
$120,166
Outstanding Balance
$97,166
Interest Rate
4.25%
Mortgage Type
FHA
Estimated Equity
$220,895
Purchase Details
Closed on
Aug 5, 2014
Sold by
Hoenes Ronald L
Bought by
Black Crystal
Home Financials for this Owner
Home Financials are based on the most recent Mortgage that was taken out on this home.
Original Mortgage
$122,735
Interest Rate
4.25%
Mortgage Type
FHA
Purchase Details
Closed on
Jul 28, 2014
Sold by
Hoenes Jacqueline B
Bought by
Hoenes Ronald L
Home Financials for this Owner
Home Financials are based on the most recent Mortgage that was taken out on this home.
Original Mortgage
$122,735
Interest Rate
4.25%
Mortgage Type
FHA
Purchase Details
Closed on
Feb 21, 2005
Sold by
Hoenes Jacqueline B
Bought by
Hoenes Ronald L
Create a Home Valuation Report for This Property
The Home Valuation Report is an in-depth analysis detailing your home's value as well as a comparison with similar homes in the area
Home Values in the Area
Average Home Value in this Area
Purchase History
| Date | Buyer | Sale Price | Title Company |
|---|---|---|---|
| Mills Crystal Black | -- | -- | |
| Black Crystal | $125,000 | -- | |
| Hoenes Ronald L | -- | -- | |
| Hoenes Ronald L | -- | -- |
Source: Public Records
Mortgage History
| Date | Status | Borrower | Loan Amount |
|---|---|---|---|
| Open | Mills Crystal Black | $120,166 | |
| Previous Owner | Black Crystal | $122,735 |
Source: Public Records
Tax History Compared to Growth
Tax History
| Year | Tax Paid | Tax Assessment Tax Assessment Total Assessment is a certain percentage of the fair market value that is determined by local assessors to be the total taxable value of land and additions on the property. | Land | Improvement |
|---|---|---|---|---|
| 2024 | $4,974 | $126,520 | $10,400 | $116,120 |
| 2023 | $4,136 | $114,560 | $10,400 | $104,160 |
| 2022 | $3,663 | $92,360 | $10,400 | $81,960 |
| 2021 | $3,188 | $79,760 | $10,400 | $69,360 |
| 2020 | $2,748 | $67,748 | $10,400 | $57,348 |
| 2019 | $2,712 | $65,878 | $9,200 | $56,678 |
| 2018 | $2,568 | $62,319 | $9,200 | $53,119 |
| 2017 | $2,257 | $54,542 | $9,200 | $45,342 |
| 2016 | $2,114 | $51,011 | $9,200 | $41,811 |
| 2015 | $1,906 | $0 | $0 | $0 |
| 2014 | $1,836 | $45,196 | $9,200 | $35,996 |
Source: Public Records
Map
Nearby Homes
- 1938 Wrights Way
- 7583 Sunstone Dr
- 7621 Raleigh Ln
- 2115 Logan Dr
- 2238 Danver Ct
- 1837 Coventry Way
- 7581 Livingston Dr
- 7672 Echo Ln
- 7620 Mount Zion Blvd
- 1904 Cades Cove
- 2254 Lisbon Ln
- 7455 Page Ct
- 7972 Woods Ln Unit IX
- 1753 Brenda Dr
- 7431 Battlecreek Ln
- 1699 Brenda Dr Unit 2
- 7519 Conkle Rd Unit 2
- 1608 Bogota Way
- 7942 Rand Rd
- 2282 Tiffany Ct
- 7471 Saybrook Trail
- 7463 Saybrook Trail
- 7627 Sherman Rd
- 1972 Wrights Way Unit 5
- 7475 Saybrook Trail
- 1952 Wrights Way
- 7479 Saybrook Trail
- 1963 Wrights Way
- 1980 Wrights Way Unit 5
- 2019 Logan Dr
- 7476 Saybrook Trail Unit 3
- 7476 Saybrook Trail
- 7668 Kennington Ln Unit 2
- 1979 Wrights Way Unit 5
- 7659 Sherman Rd
- 7609 Sherman Rd
- 1953 Wrights Way
- 7483 Saybrook Trail Unit 4
- 7480 Saybrook Trail
- 2029 Logan Dr Unit 1