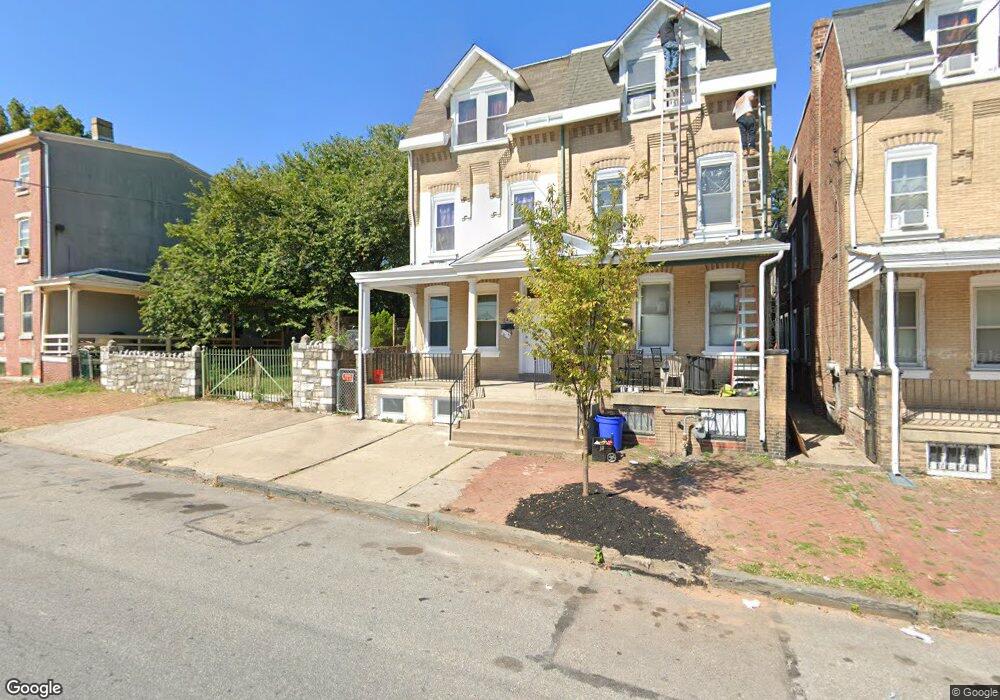
747 Astor St Norristown, PA 19401
Estimated Value: $64,515 - $224,000
5
Beds
1
Bath
2,064
Sq Ft
$78/Sq Ft
Est. Value
About This Home
This home is located at 747 Astor St, Norristown, PA 19401 and is currently estimated at $160,129, approximately $77 per square foot. 747 Astor St is a home located in Montgomery County with nearby schools including Charles Blockson Middle School, Whitehall Elementary School, and East Norriton Middle School.
Ownership History
Date
Name
Owned For
Owner Type
Purchase Details
Closed on
Jul 20, 2018
Sold by
Mcfadden David
Bought by
Metrics Rental Llc
Current Estimated Value
Purchase Details
Closed on
Dec 7, 2016
Sold by
Federal National Mortgage Association and Campbell Douglas
Bought by
Mcfadden David
Purchase Details
Closed on
Nov 8, 2002
Sold by
Myers William H
Bought by
Douglas Campbell and Douglas Debra L
Purchase Details
Closed on
Jan 4, 1990
Sold by
Litt Lawrence and Litt Sandra M
Bought by
Myers William H and Myers Myrtice
Create a Home Valuation Report for This Property
The Home Valuation Report is an in-depth analysis detailing your home's value as well as a comparison with similar homes in the area
Home Values in the Area
Average Home Value in this Area
Purchase History
| Date | Buyer | Sale Price | Title Company |
|---|---|---|---|
| Metrics Rental Llc | $40,000 | None Available | |
| Mcfadden David | $36,500 | None Available | |
| Douglas Campbell | $89,000 | -- | |
| Campbell Douglas | $89,000 | -- | |
| Myers William H | -- | -- |
Source: Public Records
Tax History Compared to Growth
Tax History
| Year | Tax Paid | Tax Assessment Tax Assessment Total Assessment is a certain percentage of the fair market value that is determined by local assessors to be the total taxable value of land and additions on the property. | Land | Improvement |
|---|---|---|---|---|
| 2025 | $1,563 | $25,450 | -- | -- |
| 2024 | $1,563 | $25,450 | -- | -- |
| 2023 | $1,549 | $25,450 | $0 | $0 |
| 2022 | $1,515 | $25,450 | $0 | $0 |
| 2021 | $1,507 | $25,450 | $0 | $0 |
| 2020 | $1,438 | $25,450 | $0 | $0 |
| 2019 | $1,412 | $25,450 | $0 | $0 |
| 2018 | $2,605 | $70,550 | $16,880 | $53,670 |
| 2017 | $3,594 | $70,550 | $16,880 | $53,670 |
| 2016 | $3,566 | $70,550 | $16,880 | $53,670 |
| 2015 | $3,481 | $70,550 | $16,880 | $53,670 |
| 2014 | $3,416 | $70,550 | $16,880 | $53,670 |
Source: Public Records
Map
Nearby Homes