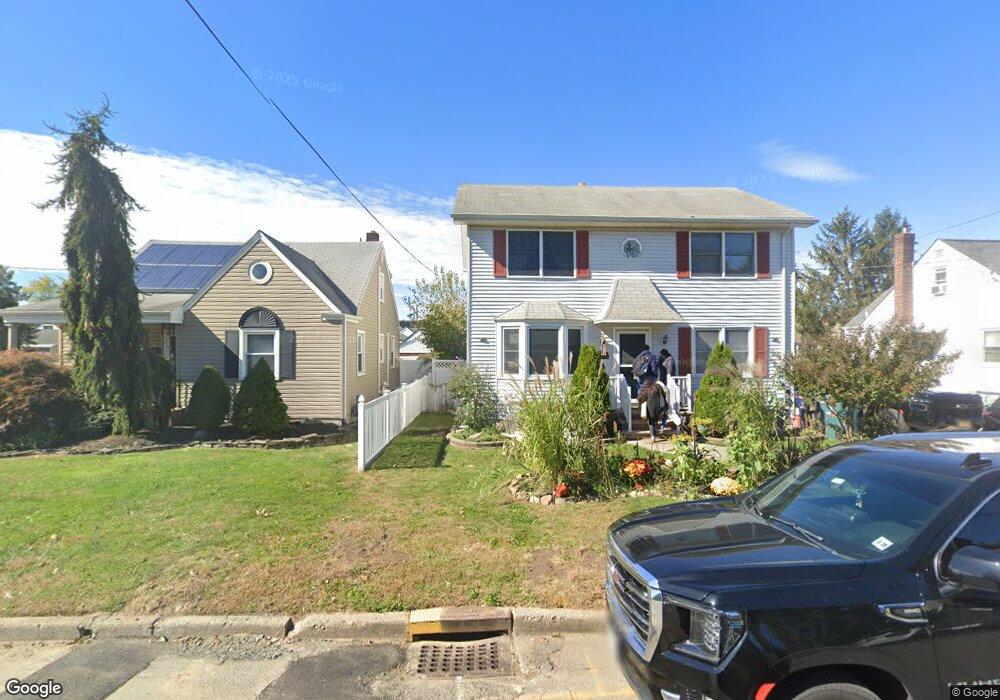
747 Lee St Perth Amboy, NJ 08861
Chickentown NeighborhoodEstimated Value: $498,599 - $559,000
--
Bed
--
Bath
1,674
Sq Ft
$312/Sq Ft
Est. Value
About This Home
This home is located at 747 Lee St, Perth Amboy, NJ 08861 and is currently estimated at $521,650, approximately $311 per square foot. 747 Lee St is a home located in Middlesex County with nearby schools including Perth Amboy High School, Academy for Urban Leadership Charter School, and Assumption Catholic School.
Ownership History
Date
Name
Owned For
Owner Type
Purchase Details
Closed on
Jan 17, 2002
Sold by
Zylka Michael
Bought by
Salerno Benjamin
Current Estimated Value
Home Financials for this Owner
Home Financials are based on the most recent Mortgage that was taken out on this home.
Original Mortgage
$220,813
Outstanding Balance
$90,940
Interest Rate
7.15%
Mortgage Type
FHA
Estimated Equity
$430,710
Purchase Details
Closed on
Jun 8, 1999
Sold by
Starego Robert
Bought by
Zylka Michael and Wilson Patricia
Home Financials for this Owner
Home Financials are based on the most recent Mortgage that was taken out on this home.
Original Mortgage
$127,800
Interest Rate
7.19%
Create a Home Valuation Report for This Property
The Home Valuation Report is an in-depth analysis detailing your home's value as well as a comparison with similar homes in the area
Home Values in the Area
Average Home Value in this Area
Purchase History
| Date | Buyer | Sale Price | Title Company |
|---|---|---|---|
| Salerno Benjamin | $229,000 | -- | |
| Zylka Michael | $142,000 | -- |
Source: Public Records
Mortgage History
| Date | Status | Borrower | Loan Amount |
|---|---|---|---|
| Open | Salerno Benjamin | $220,813 | |
| Previous Owner | Zylka Michael | $127,800 |
Source: Public Records
Tax History Compared to Growth
Tax History
| Year | Tax Paid | Tax Assessment Tax Assessment Total Assessment is a certain percentage of the fair market value that is determined by local assessors to be the total taxable value of land and additions on the property. | Land | Improvement |
|---|---|---|---|---|
| 2025 | $8,891 | $294,700 | $123,600 | $171,100 |
| 2024 | $8,873 | $294,700 | $123,600 | $171,100 |
| 2023 | $8,873 | $294,700 | $123,600 | $171,100 |
| 2022 | $8,767 | $294,700 | $123,600 | $171,100 |
| 2021 | $8,779 | $294,700 | $123,600 | $171,100 |
| 2020 | $8,776 | $294,700 | $123,600 | $171,100 |
| 2019 | $8,809 | $294,700 | $123,600 | $171,100 |
| 2018 | $8,732 | $294,700 | $123,600 | $171,100 |
| 2017 | $8,714 | $294,700 | $123,600 | $171,100 |
| 2016 | $8,487 | $294,700 | $123,600 | $171,100 |
| 2015 | $8,546 | $294,700 | $123,600 | $171,100 |
| 2014 | $8,599 | $294,700 | $123,600 | $171,100 |
Source: Public Records
Map
Nearby Homes