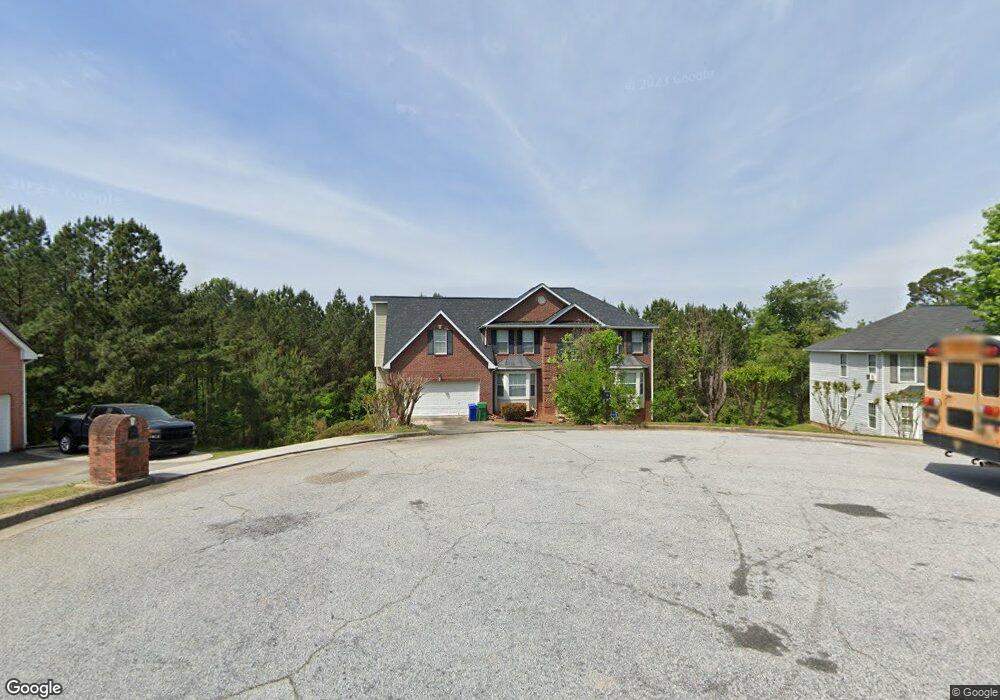
747 Trigg Lake Ct Unit 1 Stone Mountain, GA 30087
Estimated Value: $351,247 - $423,000
3
Beds
3
Baths
3,164
Sq Ft
$121/Sq Ft
Est. Value
About This Home
This home is located at 747 Trigg Lake Ct Unit 1, Stone Mountain, GA 30087 and is currently estimated at $382,562, approximately $120 per square foot. 747 Trigg Lake Ct Unit 1 is a home located in DeKalb County with nearby schools including Pine Ridge Elementary School, Stephenson Middle School, and Stephenson High School.
Ownership History
Date
Name
Owned For
Owner Type
Purchase Details
Closed on
Apr 7, 2005
Sold by
Mers
Bought by
Jones Carol R
Current Estimated Value
Home Financials for this Owner
Home Financials are based on the most recent Mortgage that was taken out on this home.
Original Mortgage
$129,900
Interest Rate
5.88%
Mortgage Type
New Conventional
Purchase Details
Closed on
Jan 4, 2005
Sold by
Demery Cynthia
Bought by
Mers
Purchase Details
Closed on
Jan 18, 2003
Sold by
Demery Ellis S
Bought by
Demery Cynthia P
Purchase Details
Closed on
Apr 5, 2002
Sold by
Demery Cynthia P
Bought by
Demery Ellis S
Purchase Details
Closed on
Aug 23, 2000
Sold by
Homelife Communities Group Inc
Bought by
Demery Cynthia
Home Financials for this Owner
Home Financials are based on the most recent Mortgage that was taken out on this home.
Original Mortgage
$207,125
Interest Rate
11.75%
Mortgage Type
New Conventional
Create a Home Valuation Report for This Property
The Home Valuation Report is an in-depth analysis detailing your home's value as well as a comparison with similar homes in the area
Home Values in the Area
Average Home Value in this Area
Purchase History
| Date | Buyer | Sale Price | Title Company |
|---|---|---|---|
| Jones Carol R | $190,000 | -- | |
| Mers | $145,084 | -- | |
| Demery Cynthia P | -- | -- | |
| Demery Ellis S | -- | -- | |
| Demery Cynthia | $207,200 | -- |
Source: Public Records
Mortgage History
| Date | Status | Borrower | Loan Amount |
|---|---|---|---|
| Closed | Jones Carol R | $129,900 | |
| Previous Owner | Demery Cynthia | $207,125 |
Source: Public Records
Tax History Compared to Growth
Tax History
| Year | Tax Paid | Tax Assessment Tax Assessment Total Assessment is a certain percentage of the fair market value that is determined by local assessors to be the total taxable value of land and additions on the property. | Land | Improvement |
|---|---|---|---|---|
| 2025 | $3,884 | $137,320 | $17,800 | $119,520 |
| 2024 | $4,055 | $139,960 | $17,800 | $122,160 |
| 2023 | $4,055 | $148,800 | $17,800 | $131,000 |
| 2022 | $3,827 | $132,200 | $14,840 | $117,360 |
| 2021 | $3,264 | $107,800 | $11,880 | $95,920 |
| 2020 | $2,885 | $91,160 | $11,880 | $79,280 |
| 2019 | $2,633 | $81,480 | $11,880 | $69,600 |
| 2018 | $2,176 | $75,280 | $11,880 | $63,400 |
| 2017 | $2,467 | $72,200 | $11,880 | $60,320 |
| 2016 | $2,230 | $67,120 | $11,880 | $55,240 |
| 2014 | $1,501 | $46,160 | $8,200 | $37,960 |
Source: Public Records
Map
Nearby Homes
- 751 Trigg Lake Ct
- 6251 Southland Forest Dr
- 717 Conisburgh Ct
- 6317 Southland Forest Dr
- 621 Lakewater View Dr Unit 1
- 505 Stephenson Rd
- 6247 Greenock Dr Unit 5
- 6588 Norcliffe Dr
- 725 Navarre Dr
- 470 Stephenson Rd
- 491 Shadow Valley Ct
- 1075 Falkirk Ln
- 6220 Pattillo Way
- 579 Shadow Lake Dr
- 6212 Lake Valley Point
- 537 Raven Springs Trail
- 1117 Falkirk Ln
- 1130 Falkirk Ln
- 515 Rock Shadow Ct
- 860 Southland Pass
- 743 Trigg Lake Ct Unit 1
- 751 Trigg Lake Ct Unit 153
- 751 Trigg Lake Ct Unit 1
- 733 Trigg Lake Ct
- 748 Trigg Lake Ct Unit 1
- 752 Trigg Lake Ct
- 744 Trigg Lake Ct
- 660 Lakewater Estates Ln
- 667 Lakewater Estates Ln
- 719 Trigg Lake Ct Unit 1
- 6214 Southland Forest Dr
- 6210 Southland Forest Dr
- 734 Trigg Lake Ct
- 642 Lakewater Estates Ln
- 642 Lakewater Estates Ln
- 661 Lakewater Estates Ln Unit 1
- 6218 Southland Forest Dr
- 634 Lakewater Estates Ln Unit 1
- 655 Lakewater Estates Ln Unit 1
- 641 Field Cliff Dr