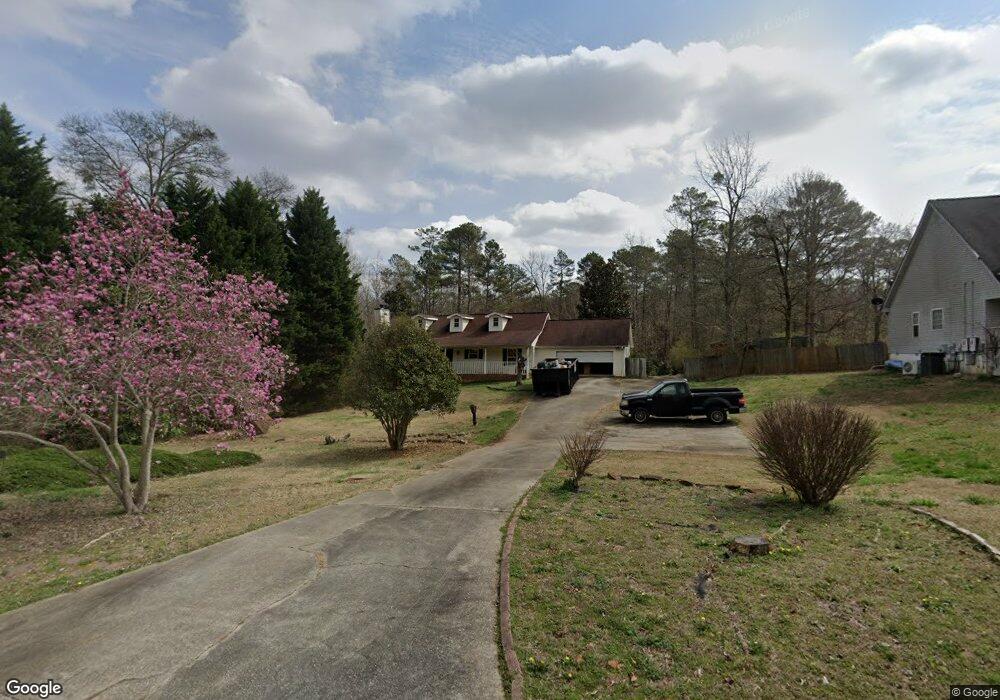
748 Creek View Dr Hoschton, GA 30548
Estimated Value: $304,000 - $399,000
--
Bed
3
Baths
1,670
Sq Ft
$213/Sq Ft
Est. Value
About This Home
This home is located at 748 Creek View Dr, Hoschton, GA 30548 and is currently estimated at $356,268, approximately $213 per square foot. 748 Creek View Dr is a home located in Jackson County with nearby schools including Gum Springs Elementary School, West Jackson Middle School, and Jackson County High School.
Ownership History
Date
Name
Owned For
Owner Type
Purchase Details
Closed on
Apr 16, 2013
Sold by
Bibby Dorothy M
Bought by
Messler Christina H
Current Estimated Value
Purchase Details
Closed on
Dec 31, 2007
Sold by
Not Provided
Bought by
Bibby Dorothy M and Messler Christina H
Home Financials for this Owner
Home Financials are based on the most recent Mortgage that was taken out on this home.
Original Mortgage
$184,200
Interest Rate
6.05%
Mortgage Type
New Conventional
Purchase Details
Closed on
May 31, 2007
Sold by
Not Provided
Bought by
Bibby Dorothy M and Messler Christina H
Home Financials for this Owner
Home Financials are based on the most recent Mortgage that was taken out on this home.
Original Mortgage
$176,000
Interest Rate
6.12%
Mortgage Type
New Conventional
Purchase Details
Closed on
Jan 30, 1998
Sold by
Holmes Thomas C
Bought by
Messler Rodney W
Purchase Details
Closed on
Apr 21, 1997
Bought by
Holmes Thomas C
Create a Home Valuation Report for This Property
The Home Valuation Report is an in-depth analysis detailing your home's value as well as a comparison with similar homes in the area
Home Values in the Area
Average Home Value in this Area
Purchase History
| Date | Buyer | Sale Price | Title Company |
|---|---|---|---|
| Messler Christina H | -- | -- | |
| Bibby Dorothy M | -- | -- | |
| Bibby Dorothy M | $167,000 | -- | |
| Messler Rodney W | $138,500 | -- | |
| Holmes Thomas C | $16,500 | -- |
Source: Public Records
Mortgage History
| Date | Status | Borrower | Loan Amount |
|---|---|---|---|
| Previous Owner | Bibby Dorothy M | $184,200 | |
| Previous Owner | Bibby Dorothy M | $176,000 |
Source: Public Records
Tax History Compared to Growth
Tax History
| Year | Tax Paid | Tax Assessment Tax Assessment Total Assessment is a certain percentage of the fair market value that is determined by local assessors to be the total taxable value of land and additions on the property. | Land | Improvement |
|---|---|---|---|---|
| 2024 | $2,651 | $109,240 | $24,000 | $85,240 |
| 2023 | $2,651 | $99,120 | $24,000 | $75,120 |
| 2022 | $2,297 | $82,680 | $24,000 | $58,680 |
| 2021 | $2,144 | $76,640 | $17,960 | $58,680 |
| 2020 | $1,886 | $61,360 | $11,840 | $49,520 |
| 2019 | $1,916 | $61,360 | $11,840 | $49,520 |
| 2018 | $1,866 | $58,920 | $11,840 | $47,080 |
| 2017 | $1,858 | $58,093 | $11,840 | $46,253 |
| 2016 | $1,868 | $58,093 | $11,840 | $46,253 |
| 2015 | $1,617 | $50,050 | $6,000 | $44,050 |
| 2014 | $1,588 | $48,755 | $6,000 | $42,755 |
| 2013 | -- | $44,906 | $6,000 | $38,906 |
Source: Public Records
Map
Nearby Homes
- 722 Creek View Dr
- 770 Creek View Dr
- 680 Creek View Dr
- 733 Creek View Dr
- 753 Creek View Dr
- 800 Creek View Dr
- 620 Creek View Dr
- 707 Creek View Dr
- 785 Creek View Dr
- 810 Creek View Dr
- 810 Creek View Dr Unit 77
- 805 Creek View Dr Unit 75
- 805 Creek View Dr
- 111 Boulder Crest
- 20 Flint Ct
- 647 Creek View Dr
- 635 Creek View Dr
- 57 Boulder Crest
- 817 Creek View Dr
- 87 Boulder Crescent