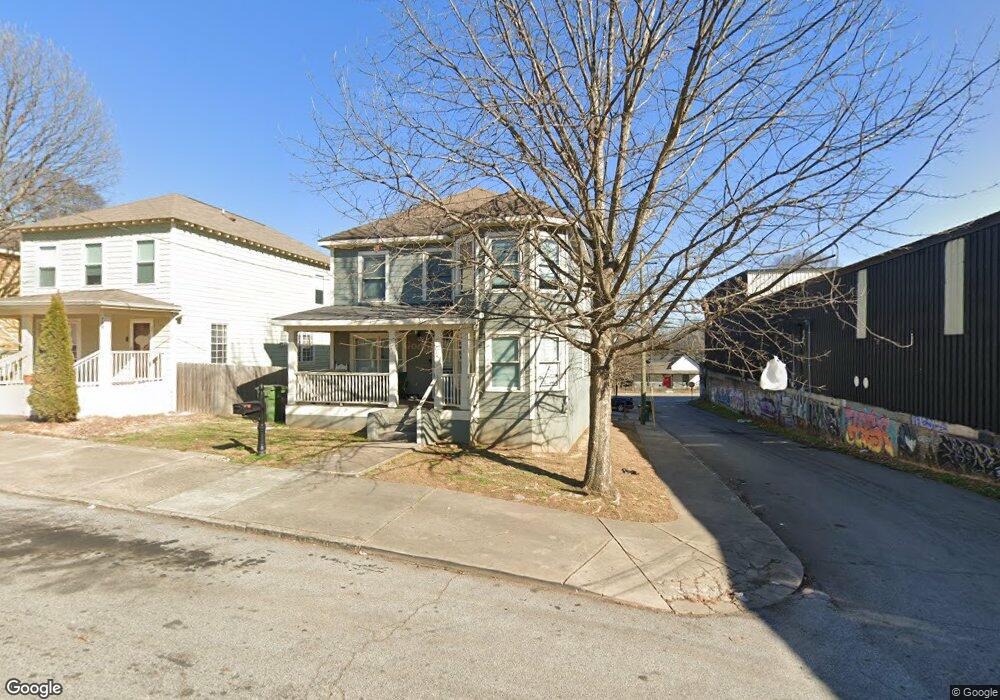
748 Garibaldi St SW Atlanta, GA 30310
Mechanicsville NeighborhoodEstimated Value: $290,621 - $356,000
4
Beds
3
Baths
1,840
Sq Ft
$175/Sq Ft
Est. Value
About This Home
This home is located at 748 Garibaldi St SW, Atlanta, GA 30310 and is currently estimated at $321,155, approximately $174 per square foot. 748 Garibaldi St SW is a home located in Fulton County with nearby schools including Dunbar Elementary School, King Middle School, and Maynard Holbrook Jackson High School.
Ownership History
Date
Name
Owned For
Owner Type
Purchase Details
Closed on
Jan 14, 2014
Sold by
Equity Trust Co Custodian
Bought by
Rutenberg Andre S and Rutneberg Minette
Current Estimated Value
Home Financials for this Owner
Home Financials are based on the most recent Mortgage that was taken out on this home.
Original Mortgage
$71,250
Outstanding Balance
$53,975
Interest Rate
4.48%
Mortgage Type
New Conventional
Estimated Equity
$267,180
Purchase Details
Closed on
Apr 29, 2013
Sold by
Lawerence Eric
Bought by
Grebow Investments Llc
Purchase Details
Closed on
Dec 14, 2007
Sold by
Eric Lawrence Contractors Inc
Bought by
Lawrence Eric
Create a Home Valuation Report for This Property
The Home Valuation Report is an in-depth analysis detailing your home's value as well as a comparison with similar homes in the area
Home Values in the Area
Average Home Value in this Area
Purchase History
| Date | Buyer | Sale Price | Title Company |
|---|---|---|---|
| Rutenberg Andre S | $95,000 | -- | |
| Grebow Investments Llc | $25,000 | -- | |
| Lawrence Eric | -- | -- |
Source: Public Records
Mortgage History
| Date | Status | Borrower | Loan Amount |
|---|---|---|---|
| Open | Rutenberg Andre S | $71,250 |
Source: Public Records
Tax History Compared to Growth
Tax History
| Year | Tax Paid | Tax Assessment Tax Assessment Total Assessment is a certain percentage of the fair market value that is determined by local assessors to be the total taxable value of land and additions on the property. | Land | Improvement |
|---|---|---|---|---|
| 2025 | $3,247 | $106,840 | $21,360 | $85,480 |
| 2023 | $4,238 | $102,360 | $25,680 | $76,680 |
| 2022 | $4,143 | $102,360 | $25,680 | $76,680 |
| 2021 | $3,733 | $80,120 | $17,320 | $62,800 |
| 2020 | $2,574 | $62,840 | $14,280 | $48,560 |
| 2019 | $483 | $45,480 | $9,920 | $35,560 |
| 2018 | $1,822 | $44,000 | $10,400 | $33,600 |
| 2017 | $955 | $22,120 | $4,600 | $17,520 |
| 2016 | $958 | $22,120 | $4,600 | $17,520 |
| 2015 | $893 | $10,000 | $2,080 | $7,920 |
| 2014 | $453 | $10,000 | $2,080 | $7,920 |
Source: Public Records
Map
Nearby Homes