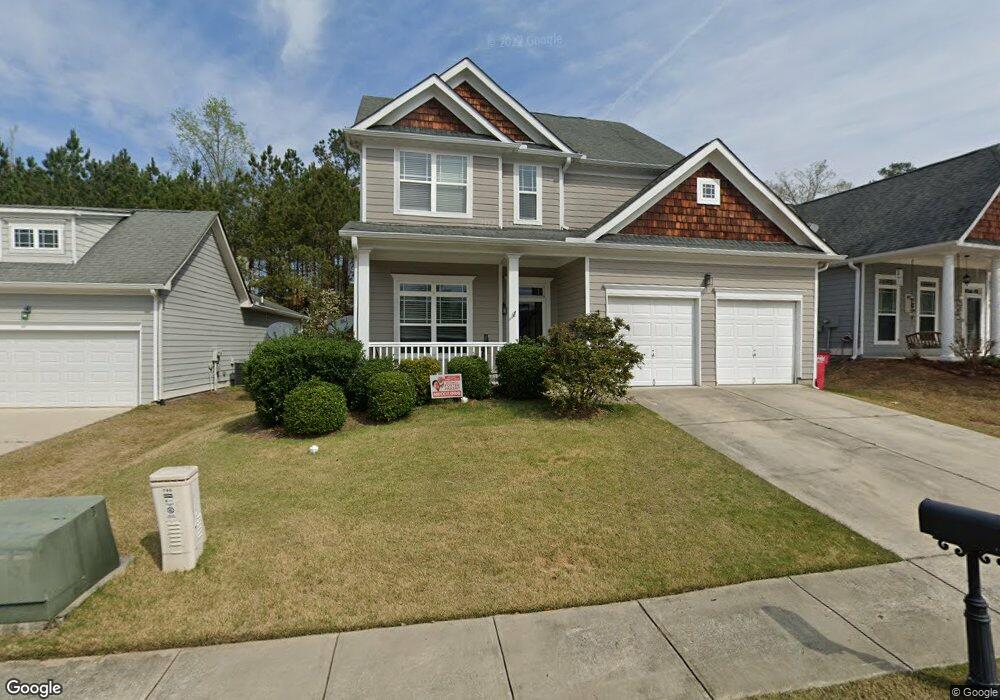
748 Ivy Brook Way Unit 33 Macon, GA 31210
Estimated Value: $225,000 - $252,273
4
Beds
3
Baths
2,147
Sq Ft
$113/Sq Ft
Est. Value
About This Home
This home is located at 748 Ivy Brook Way Unit 33, Macon, GA 31210 and is currently estimated at $242,568, approximately $112 per square foot. 748 Ivy Brook Way Unit 33 is a home located in Bibb County with nearby schools including Carter Elementary School, Howard Middle School, and Howard High School.
Ownership History
Date
Name
Owned For
Owner Type
Purchase Details
Closed on
Jul 7, 2022
Sold by
Small Natasha
Bought by
Small Natasha Nicole and Small Robert
Current Estimated Value
Home Financials for this Owner
Home Financials are based on the most recent Mortgage that was taken out on this home.
Original Mortgage
$196,377
Outstanding Balance
$190,016
Interest Rate
7.7%
Mortgage Type
FHA
Estimated Equity
$52,552
Purchase Details
Closed on
Jul 12, 2021
Sold by
Foshee Charles W and Foshee April E
Bought by
Halo Fund 1 Llc
Purchase Details
Closed on
Sep 29, 2006
Sold by
Sivica Homes Inc
Bought by
Foshee Charles W and Foshee April E
Home Financials for this Owner
Home Financials are based on the most recent Mortgage that was taken out on this home.
Original Mortgage
$172,499
Interest Rate
6.36%
Mortgage Type
FHA
Purchase Details
Closed on
May 10, 2005
Create a Home Valuation Report for This Property
The Home Valuation Report is an in-depth analysis detailing your home's value as well as a comparison with similar homes in the area
Home Values in the Area
Average Home Value in this Area
Purchase History
| Date | Buyer | Sale Price | Title Company |
|---|---|---|---|
| Small Natasha Nicole | -- | Crane Elder Law Firm Llc | |
| Small Natasha | $205,000 | Crane Elder Law Firm Llc | |
| Halo Fund 1 Llc | $189,000 | None Available | |
| Foshee Charles W | $173,900 | None Avilabale | |
| -- | $360,000 | -- |
Source: Public Records
Mortgage History
| Date | Status | Borrower | Loan Amount |
|---|---|---|---|
| Open | Small Natasha | $196,377 | |
| Closed | Small Natasha | $196,377 | |
| Previous Owner | Foshee Charles W | $172,499 | |
| Closed | Small Natasha | $7,000 |
Source: Public Records
Tax History Compared to Growth
Tax History
| Year | Tax Paid | Tax Assessment Tax Assessment Total Assessment is a certain percentage of the fair market value that is determined by local assessors to be the total taxable value of land and additions on the property. | Land | Improvement |
|---|---|---|---|---|
| 2025 | $2,243 | $91,285 | $8,000 | $83,285 |
| 2024 | $2,117 | $83,353 | $8,000 | $75,353 |
| 2023 | $2,083 | $83,353 | $8,000 | $75,353 |
| 2022 | $2,379 | $68,707 | $12,400 | $56,307 |
| 2021 | $2,097 | $55,182 | $10,136 | $45,046 |
| 2020 | $2,104 | $54,202 | $10,136 | $44,066 |
| 2019 | $1,763 | $45,033 | $7,240 | $37,793 |
| 2018 | $2,795 | $43,626 | $7,240 | $36,386 |
| 2017 | $1,635 | $43,626 | $7,240 | $36,386 |
| 2016 | $1,509 | $43,626 | $7,240 | $36,386 |
| 2015 | $2,136 | $43,626 | $7,240 | $36,386 |
| 2014 | $2,140 | $43,626 | $7,240 | $36,386 |
Source: Public Records
Map
Nearby Homes
- 740 Ivy Brook Way
- 776 Ivy Brook Way
- 631 Ivy Brook Way
- 785 Ivy Brook Way
- 2006 Fall Harvest Dr Unit LOT 278
- 2002 Fall Harvest Dr Unit LOT 280
- 2006 Fall Harvest Dr
- 2002 Fall Harvest Dr
- 2008 Fall Harvest Dr Unit LOT 277
- 2004 Fall Harvest Dr
- 2010 Fall Harvest Dr Unit LOT 276
- 2010 Fall Harvest Dr
- 2008 Fall Harvest Dr
- 2004 Fall Harvest Dr Unit LOT 279
- 715 Ivy Brook Way
- 621 Ivy Brook Way
- 534 Ivy Brook Way
- 4508 Bon Ayer Cir
- 748 Ivy Brook Way
- 752 Ivy Brook Way
- 744 Ivy Brook Way
- 788 Ivy Brook Way
- 740 Ivy Brook Way Unit 103-32
- 756 Ivy Brook Way Unit 335/13
- 756 Ivy Brook Way
- 736 Ivy Brook Way
- 736 Ivy Brook Way Unit 31
- 760 Ivy Brook Way
- 332 Harvest Walk
- 745 Ivy Brook Way
- 764 Ivy Brook Way
- 743 Ivy Brook Way
- 330 Harvest Walk
- 732 Ivy Brook Way
- 739 Ivy Brook Way
- 245 Rutledge Way Unit 27
- 245 Rutledge Way
- 333 Harvest Walk