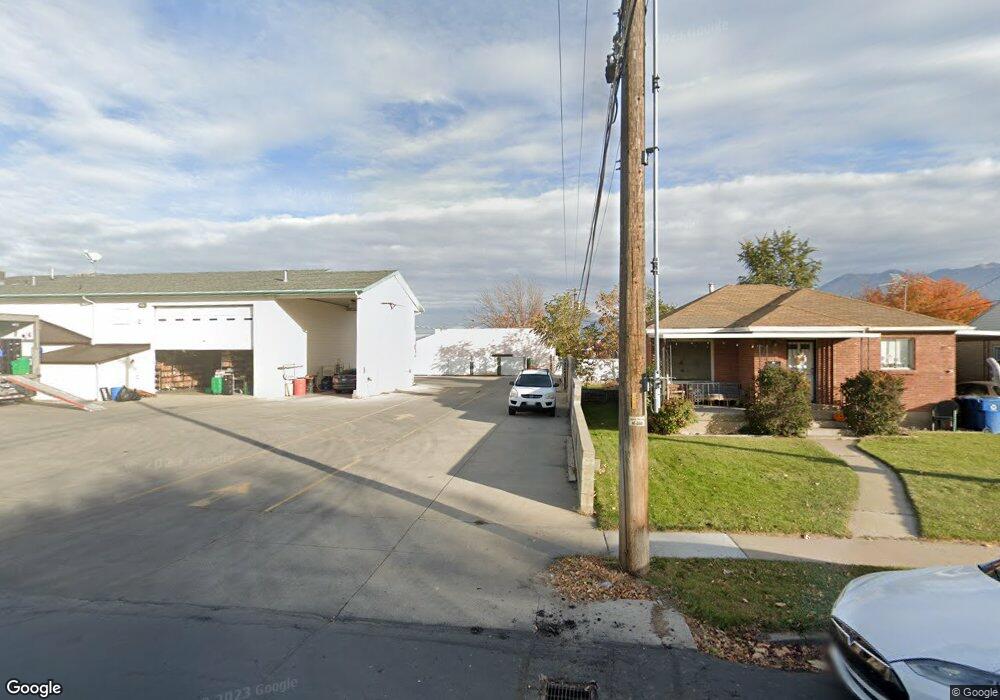
748 N Main St Spanish Fork, UT 84660
--
Bed
--
Bath
3,635
Sq Ft
4,356
Sq Ft Lot
About This Home
This home is located at 748 N Main St, Spanish Fork, UT 84660. 748 N Main St is a home located in Utah County with nearby schools including Park Elementary School, Diamond Fork Junior High School, and Spanish Fork Jr High School.
Ownership History
Date
Name
Owned For
Owner Type
Purchase Details
Closed on
Oct 12, 2023
Sold by
Nguyen Duke Cong and Tram Truclinh Thi
Bought by
Nguyen Duke Cong
Purchase Details
Closed on
Jun 23, 2020
Sold by
Bui Hiep T
Bought by
Nguyen Duke Cong and Tran Truclinh Thi
Purchase Details
Closed on
Nov 29, 2018
Sold by
Grant & Edna Investment Llc
Bought by
Nguyen Duke Cong and Bui Hiep T
Home Financials for this Owner
Home Financials are based on the most recent Mortgage that was taken out on this home.
Original Mortgage
$520,000
Interest Rate
4.8%
Mortgage Type
Commercial
Purchase Details
Closed on
Jan 27, 2014
Sold by
Jensen Grant Carl and Jensen Edna Cook
Bought by
Grant & Edna Investments Llc
Create a Home Valuation Report for This Property
The Home Valuation Report is an in-depth analysis detailing your home's value as well as a comparison with similar homes in the area
Home Values in the Area
Average Home Value in this Area
Purchase History
| Date | Buyer | Sale Price | Title Company |
|---|---|---|---|
| Nguyen Duke Cong | -- | Key Land Title | |
| Nguyen Duke Cong | -- | None Available | |
| Nguyen Duke Cong | -- | Greenbrier Title Ins Agency | |
| Grant & Edna Investments Llc | -- | None Available |
Source: Public Records
Mortgage History
| Date | Status | Borrower | Loan Amount |
|---|---|---|---|
| Previous Owner | Nguyen Duke Cong | $520,000 |
Source: Public Records
Tax History Compared to Growth
Tax History
| Year | Tax Paid | Tax Assessment Tax Assessment Total Assessment is a certain percentage of the fair market value that is determined by local assessors to be the total taxable value of land and additions on the property. | Land | Improvement |
|---|---|---|---|---|
| 2025 | $6,644 | $682,100 | $292,200 | $389,900 |
| 2024 | $6,644 | $684,800 | $0 | $0 |
| 2023 | $6,044 | $623,700 | $0 | $0 |
| 2022 | $5,716 | $578,500 | $252,200 | $326,300 |
| 2021 | $4,970 | $442,600 | $246,900 | $195,700 |
| 2020 | $5,382 | $465,900 | $186,700 | $279,200 |
| 2019 | $4,944 | $450,300 | $169,800 | $280,500 |
| 2018 | $5,060 | $445,500 | $161,800 | $283,700 |
| 2017 | $5,079 | $437,000 | $0 | $0 |
| 2016 | $4,743 | $402,700 | $0 | $0 |
| 2015 | $4,338 | $363,900 | $0 | $0 |
| 2014 | $4,026 | $339,000 | $0 | $0 |
Source: Public Records
Map
Nearby Homes