Estimated Value: $203,000 - $222,000
2
Beds
2
Baths
1,190
Sq Ft
$178/Sq Ft
Est. Value
About This Home
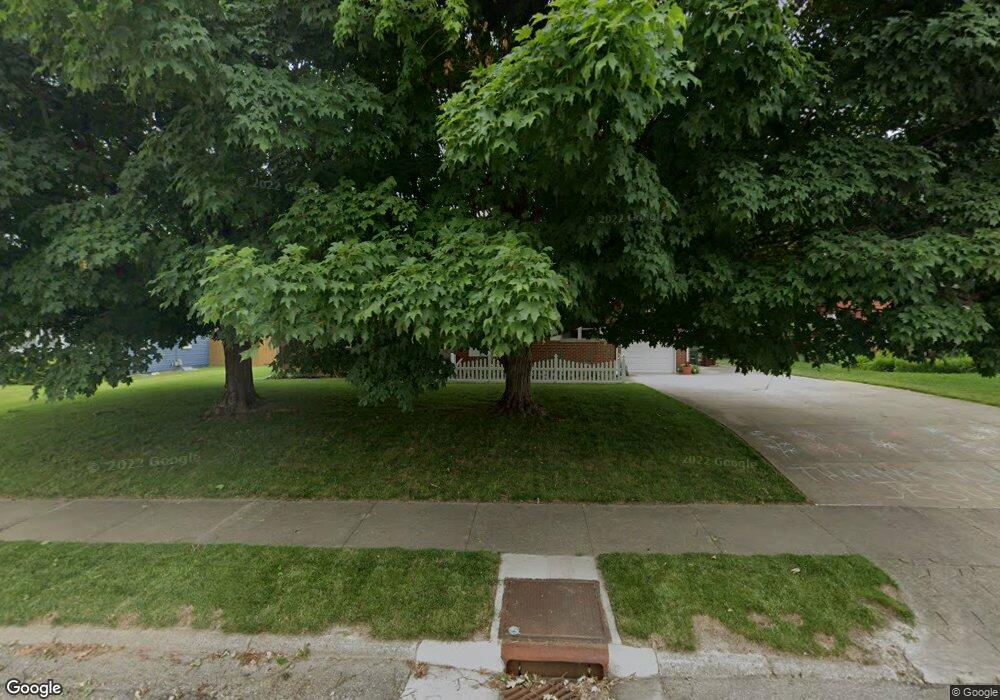
This home is located at 748 N Monroe Dr, Xenia, OH 45385 and is currently estimated at $212,055, approximately $178 per square foot. 748 N Monroe Dr is a home located in Greene County with nearby schools including Xenia High School, Summit Academy Community School for Alternative Learners - Xenia, and Legacy Christian Academy.
Ownership History
Date
Name
Owned For
Owner Type
Purchase Details
Closed on
Sep 22, 2014
Sold by
Campana Patrick R and Campana Joyce A
Bought by
Skelly Barry W and Skelly Sally J
Current Estimated Value
Home Financials for this Owner
Home Financials are based on the most recent Mortgage that was taken out on this home.
Original Mortgage
$88,825
Outstanding Balance
$67,825
Interest Rate
4.07%
Mortgage Type
Unknown
Estimated Equity
$144,230
Purchase Details
Closed on
Nov 30, 2005
Sold by
Estate Of Linda Deanne Campana
Bought by
Campana Patrick R
Purchase Details
Closed on
Oct 4, 2002
Sold by
Bickett Gary K and Bickett Susan
Bought by
Campana L Deanne
Purchase Details
Closed on
May 3, 2002
Sold by
Bickett Nellie A
Bought by
Campana L Deanne and Bickett Gary K
Purchase Details
Closed on
Jun 4, 1998
Sold by
Estate Of Robert M Bickett
Bought by
Bickett Nellie A
Purchase Details
Closed on
Oct 20, 1989
Bought by
Campana Patrick R
Create a Home Valuation Report for This Property
The Home Valuation Report is an in-depth analysis detailing your home's value as well as a comparison with similar homes in the area
Home Values in the Area
Average Home Value in this Area
Purchase History
| Date | Buyer | Sale Price | Title Company |
|---|---|---|---|
| Skelly Barry W | $93,500 | None Available | |
| Campana Patrick R | -- | None Available | |
| Campana L Deanne | -- | -- | |
| Campana L Deanne | -- | -- | |
| Bickett Nellie A | -- | -- | |
| Campana Patrick R | $68,000 | -- |
Source: Public Records
Mortgage History
| Date | Status | Borrower | Loan Amount |
|---|---|---|---|
| Open | Skelly Barry W | $88,825 |
Source: Public Records
Tax History Compared to Growth
Tax History
| Year | Tax Paid | Tax Assessment Tax Assessment Total Assessment is a certain percentage of the fair market value that is determined by local assessors to be the total taxable value of land and additions on the property. | Land | Improvement |
|---|---|---|---|---|
| 2024 | $2,523 | $58,960 | $13,000 | $45,960 |
| 2023 | $2,523 | $58,960 | $13,000 | $45,960 |
| 2022 | $2,148 | $42,810 | $8,120 | $34,690 |
| 2021 | $2,177 | $42,810 | $8,120 | $34,690 |
| 2020 | $2,085 | $42,810 | $8,120 | $34,690 |
| 2019 | $1,604 | $30,990 | $8,970 | $22,020 |
| 2018 | $1,610 | $30,990 | $8,970 | $22,020 |
| 2017 | $1,563 | $30,990 | $8,970 | $22,020 |
| 2016 | $1,488 | $28,100 | $8,970 | $19,130 |
| 2015 | $1,492 | $28,100 | $8,970 | $19,130 |
| 2014 | $956 | $28,100 | $8,970 | $19,130 |
Source: Public Records
Map
Nearby Homes
- 659 N King St
- 508 Marshall Dr
- 878 N Detroit St
- 479 N Stadium Dr
- 513 Redbud Ln
- 348 S Stadium Dr
- 902 N Detroit St
- 516 N King St
- 568 Louise Dr
- 119 Park Dr
- 613 N West St
- 1038 Frederick Dr
- 137 Pleasant St
- 610 Saxony Dr
- 656 Eden Roc Dr
- 1171 N Detroit St
- 645 E Church St
- 612 E Market St
- 541 E Main St
- 607 E Main St
- 734 N Monroe Dr
- 764 N Monroe Dr
- 689 Sutton Dr
- 673 Sutton Dr
- 707 Sutton Dr
- 718 N Monroe Dr
- 784 N Monroe Dr
- 659 Sutton Dr
- 755 N Monroe Dr
- 735 N Monroe Dr
- 721 Sutton Dr
- 771 N Monroe Dr
- 641 Sutton Dr
- 717 N Monroe Dr
- 700 N Monroe Dr
- 800 N Monroe Dr
- 698 Smith Ave
- 787 N Monroe Dr
- 743 Sutton Dr
- 699 Smith Ave