Estimated Value: $239,000 - $272,000
3
Beds
1
Bath
1,333
Sq Ft
$194/Sq Ft
Est. Value
About This Home
This home is located at 748 Oak Dr, Hurst, TX 76053 and is currently estimated at $258,136, approximately $193 per square foot. 748 Oak Dr is a home located in Tarrant County with nearby schools including West Hurst Elementary School, Hurst J High School, and L.D. Bell High School.
Ownership History
Date
Name
Owned For
Owner Type
Purchase Details
Closed on
Nov 25, 2025
Sold by
Rosenberg Genevieve A
Bought by
Pravu Llc
Current Estimated Value
Purchase Details
Closed on
Nov 5, 2008
Sold by
Bradford Doris M
Bought by
Hometex Afw Llc
Home Financials for this Owner
Home Financials are based on the most recent Mortgage that was taken out on this home.
Original Mortgage
$57,522
Interest Rate
6.08%
Mortgage Type
Purchase Money Mortgage
Create a Home Valuation Report for This Property
The Home Valuation Report is an in-depth analysis detailing your home's value as well as a comparison with similar homes in the area
Home Values in the Area
Average Home Value in this Area
Purchase History
| Date | Buyer | Sale Price | Title Company |
|---|---|---|---|
| Pravu Llc | -- | Texas Excel Title | |
| Hometex Afw Llc | -- | Title Resources Of North Tex |
Source: Public Records
Mortgage History
| Date | Status | Borrower | Loan Amount |
|---|---|---|---|
| Previous Owner | Hometex Afw Llc | $57,522 |
Source: Public Records
Tax History
| Year | Tax Paid | Tax Assessment Tax Assessment Total Assessment is a certain percentage of the fair market value that is determined by local assessors to be the total taxable value of land and additions on the property. | Land | Improvement |
|---|---|---|---|---|
| 2025 | $569 | $247,173 | $60,000 | $187,173 |
| 2024 | $569 | $247,173 | $60,000 | $187,173 |
| 2023 | $588 | $247,396 | $30,000 | $217,396 |
| 2022 | $3,675 | $206,113 | $30,000 | $176,113 |
| 2021 | $3,499 | $184,993 | $30,000 | $154,993 |
| 2020 | $3,173 | $150,901 | $30,000 | $120,901 |
| 2019 | $2,935 | $148,101 | $30,000 | $118,101 |
| 2018 | $2,160 | $109,009 | $19,000 | $90,009 |
| 2017 | $2,508 | $126,276 | $19,000 | $107,276 |
| 2016 | $2,280 | $90,481 | $19,000 | $71,481 |
| 2015 | $1,773 | $81,900 | $15,000 | $66,900 |
| 2014 | $1,773 | $81,900 | $15,000 | $66,900 |
Source: Public Records
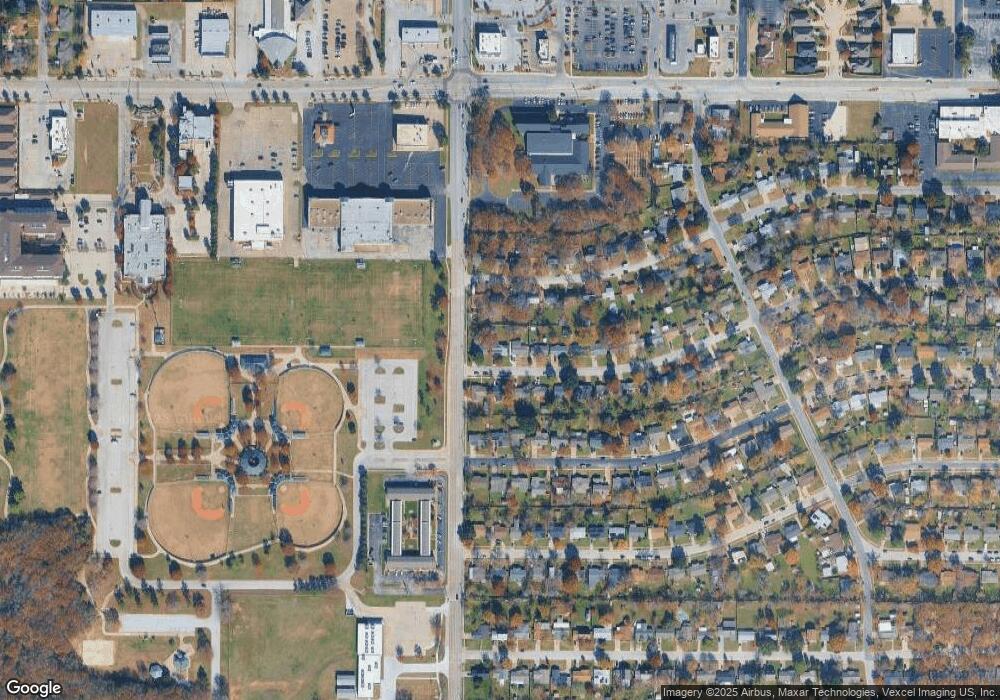
Map
Nearby Homes
- 712 Pine St
- 758 Briarwood Ln
- 756 Briarwood Ln
- 813 Chase Cir
- 852 W Redbud Dr
- 709 Hurstview Dr
- 729 W Cheryl Ave
- 540 Billie Ruth Ln
- 416 Simmons Dr
- 512 Billie Ruth Ln
- 624 Forest Ln
- 608 W Redbud Dr
- 408 Simmons Dr
- 324 Moore Creek Rd
- 623 Ridgeline Dr
- 655 Ridgeline Dr
- 512 Shadowbrook Ln
- 780 Betty Ln
- 808 Betty Ct
- 913 Zelda Dr
Your Personal Tour Guide
Ask me questions while you tour the home.