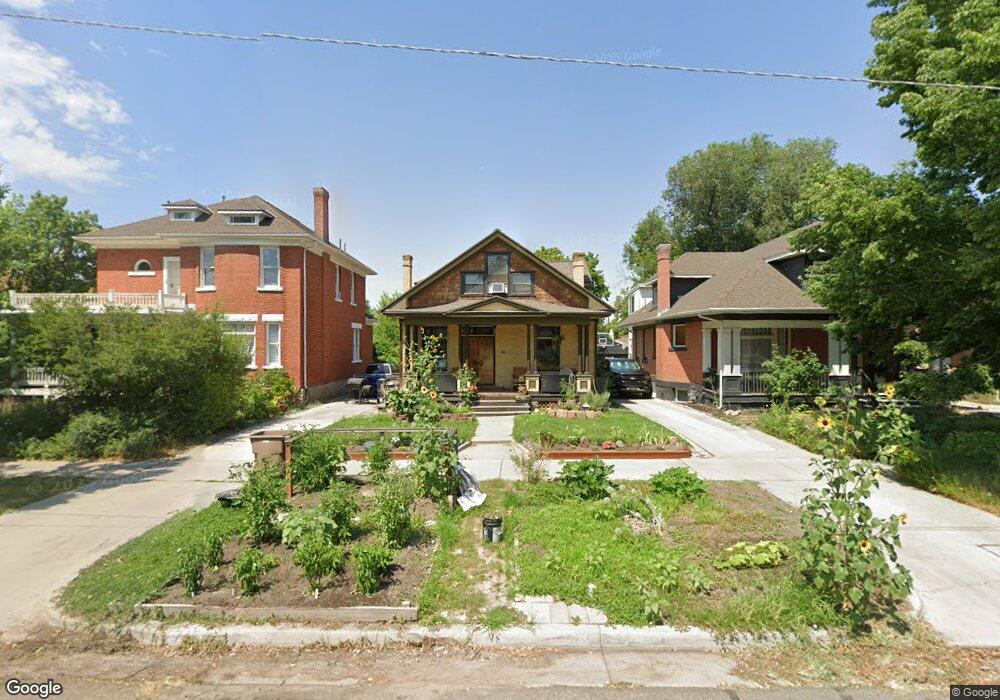
748 S 600 E Salt Lake City, UT 84102
Central City NeighborhoodEstimated Value: $631,000 - $705,000
3
Beds
3
Baths
1,576
Sq Ft
$416/Sq Ft
Est. Value
About This Home
This home is located at 748 S 600 E, Salt Lake City, UT 84102 and is currently estimated at $656,143, approximately $416 per square foot. 748 S 600 E is a home located in Salt Lake County with nearby schools including Bennion Elementary School, Liberty Elementary School, and Highland High School.
Ownership History
Date
Name
Owned For
Owner Type
Purchase Details
Closed on
Oct 26, 2018
Sold by
Farnsworth Claire C
Bought by
Goo Brandan
Current Estimated Value
Home Financials for this Owner
Home Financials are based on the most recent Mortgage that was taken out on this home.
Original Mortgage
$177,500
Outstanding Balance
$155,434
Interest Rate
4.6%
Mortgage Type
New Conventional
Estimated Equity
$500,709
Purchase Details
Closed on
Feb 9, 2018
Sold by
Farnsworth Claire C
Bought by
Goo Brandan M
Purchase Details
Closed on
Dec 13, 1996
Sold by
Farnsworth Kent R and Farnsworth Claire C
Bought by
Farnsworth Kent R and Farnsworth Claire C
Home Financials for this Owner
Home Financials are based on the most recent Mortgage that was taken out on this home.
Original Mortgage
$21,050
Interest Rate
7.67%
Create a Home Valuation Report for This Property
The Home Valuation Report is an in-depth analysis detailing your home's value as well as a comparison with similar homes in the area
Home Values in the Area
Average Home Value in this Area
Purchase History
| Date | Buyer | Sale Price | Title Company |
|---|---|---|---|
| Goo Brandan | -- | Advanced Title Slc | |
| Goo Brandan | -- | Advanced Title Slc | |
| Goo Brandan M | -- | None Available | |
| Farnsworth Kent R | -- | -- |
Source: Public Records
Mortgage History
| Date | Status | Borrower | Loan Amount |
|---|---|---|---|
| Open | Goo Brandan | $177,500 | |
| Previous Owner | Farnsworth Kent R | $21,050 |
Source: Public Records
Tax History Compared to Growth
Tax History
| Year | Tax Paid | Tax Assessment Tax Assessment Total Assessment is a certain percentage of the fair market value that is determined by local assessors to be the total taxable value of land and additions on the property. | Land | Improvement |
|---|---|---|---|---|
| 2025 | $3,165 | $641,500 | $184,000 | $457,500 |
| 2024 | $3,165 | $603,900 | $174,100 | $429,800 |
| 2023 | $3,169 | $582,800 | $167,400 | $415,400 |
| 2022 | $3,419 | $590,000 | $146,500 | $443,500 |
| 2021 | $2,999 | $468,600 | $114,800 | $353,800 |
| 2020 | $1,915 | $284,700 | $103,000 | $181,700 |
| 2019 | $1,953 | $273,200 | $76,000 | $197,200 |
| 2018 | $0 | $268,100 | $76,000 | $192,100 |
| 2017 | $2,009 | $256,400 | $76,000 | $180,400 |
| 2016 | $1,837 | $222,700 | $66,500 | $156,200 |
| 2015 | $1,735 | $199,300 | $65,200 | $134,100 |
| 2014 | $1,737 | $198,000 | $67,200 | $130,800 |
Source: Public Records
Map
Nearby Homes