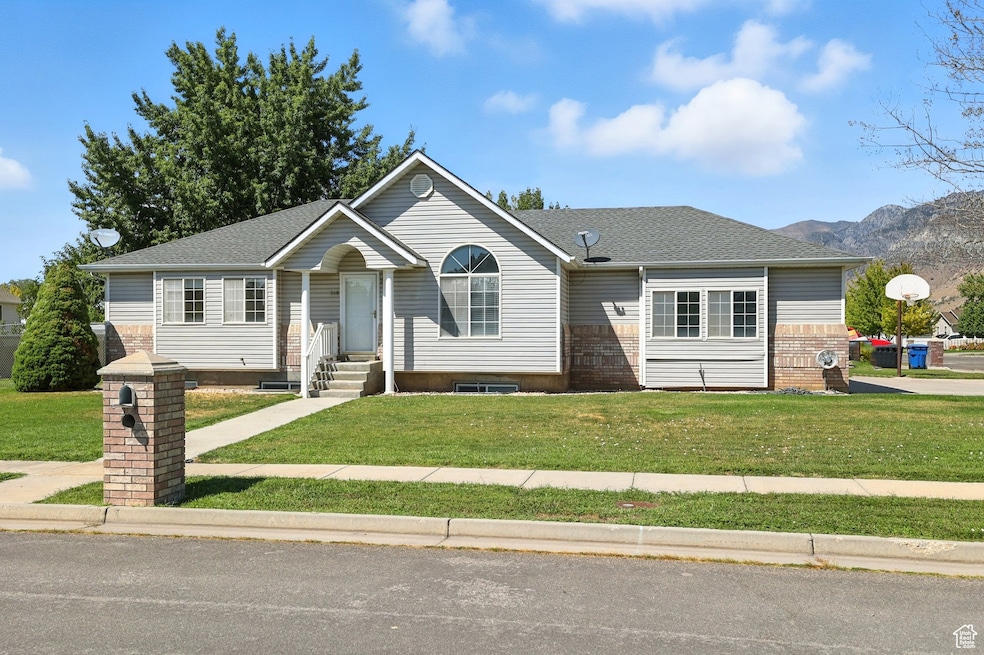
748 W 650 N Brigham City, UT 84302
Estimated payment $2,906/month
Highlights
- Mature Trees
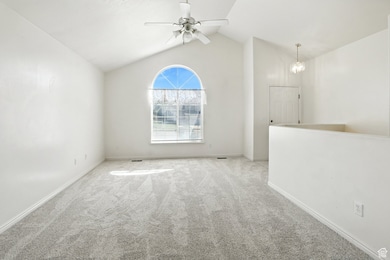
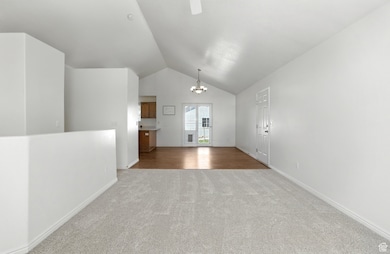
- Vaulted Ceiling
- Main Floor Primary Bedroom
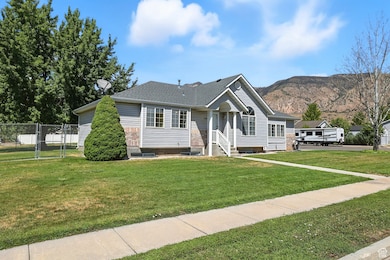
- Mountain View
- Rambler Architecture
- Corner Lot
About This Home
PRICE REDUCED ! Come check out this amazing 5 Bedroom , 3 Bathroom home in Brigham City on a corner lot! New carpet upstairs! Lots of space for entertaining with family and friends! Fenced yard that is perfect for your furry friends with a secure doggy door! Close to shopping, restaurants, and 5 minutes to the freeway! Come take a look and make this amazing house your new home!
Listing Agent
Melissa Wilkes
Encompass Realty Group LLC License #194023 Listed on: 08/25/2025
Home Details
Home Type
- Single Family
Est. Annual Taxes
- $1,983
Year Built
- Built in 1998
Lot Details
- 0.26 Acre Lot
- Property is Fully Fenced
- Landscaped
- Corner Lot
- Sprinkler System
- Mature Trees
- Property is zoned Single-Family
Parking
- 2 Car Attached Garage
- 4 Open Parking Spaces
Home Design
- Rambler Architecture
- Brick Exterior Construction
- Asphalt
Interior Spaces
- 2,362 Sq Ft Home
- 2-Story Property
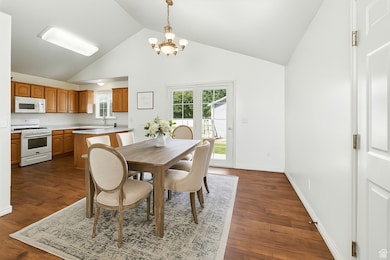
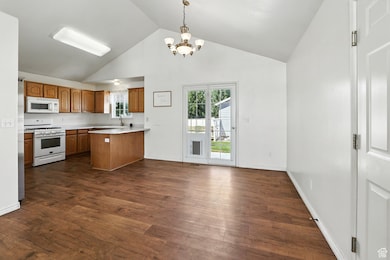
- Vaulted Ceiling
- Ceiling Fan
- Double Pane Windows
- Blinds
- French Doors
- Mountain Views
- Fire and Smoke Detector
- Gas Dryer Hookup
Kitchen
- Gas Oven
- Built-In Range
- Range Hood
- Microwave
- Disposal
Flooring
- Carpet
- Laminate
- Tile
Bedrooms and Bathrooms
- 5 Bedrooms | 3 Main Level Bedrooms
- Primary Bedroom on Main
- Bathtub With Separate Shower Stall
Basement
- Basement Fills Entire Space Under The House
- Natural lighting in basement
Outdoor Features
- Open Patio
- Basketball Hoop
Schools
- Discovery Elementary School
- Adele C. Young Middle School
- Box Elder High School
Utilities
- Central Heating and Cooling System
- Natural Gas Connected
Community Details
- No Home Owners Association
- Carriage Subdivision
Listing and Financial Details
- Home warranty included in the sale of the property
- Assessor Parcel Number 03-203-0018
Map
Home Values in the Area
Average Home Value in this Area
Tax History
| Year | Tax Paid | Tax Assessment Tax Assessment Total Assessment is a certain percentage of the fair market value that is determined by local assessors to be the total taxable value of land and additions on the property. | Land | Improvement |
|---|---|---|---|---|
| 2025 | $2,264 | $389,327 | $105,000 | $284,327 |
| 2024 | $1,983 | $381,772 | $100,000 | $281,772 |
| 2023 | $2,071 | $408,197 | $95,000 | $313,197 |
| 2022 | $2,127 | $214,326 | $22,000 | $192,326 |
| 2021 | $1,721 | $269,316 | $40,000 | $229,316 |
| 2020 | $1,658 | $269,316 | $40,000 | $229,316 |
| 2019 | $1,546 | $133,614 | $22,000 | $111,614 |
| 2018 | $1,385 | $119,056 | $22,000 | $97,056 |
| 2017 | $1,038 | $154,442 | $16,500 | $124,442 |
| 2016 | $1,085 | $81,684 | $16,500 | $65,184 |
| 2015 | $1,006 | $75,758 | $16,500 | $59,258 |
| 2014 | $1,006 | $72,936 | $16,500 | $56,436 |
| 2013 | -- | $72,936 | $16,500 | $56,436 |
Property History
| Date | Event | Price | List to Sale | Price per Sq Ft |
|---|---|---|---|---|
| 10/21/2025 10/21/25 | Price Changed | $520,000 | -1.0% | $220 / Sq Ft |
| 08/25/2025 08/25/25 | For Sale | $525,000 | -- | $222 / Sq Ft |
Purchase History
| Date | Type | Sale Price | Title Company |
|---|---|---|---|
| Warranty Deed | -- | North American Title Union P | |
| Warranty Deed | -- | Phillips Hansen Land Title C | |
| Warranty Deed | -- | American Secure Title | |
| Warranty Deed | -- | American Secure Title |
Mortgage History
| Date | Status | Loan Amount | Loan Type |
|---|---|---|---|
| Open | $175,000 | New Conventional | |
| Previous Owner | $157,055 | VA |
Source: UtahRealEstate.com
MLS Number: 2107190
APN: 03-203-0018
Disclaimer: Certain information contained herein is derived from information provided by parties other than Homes.com. All information provided is deemed reliable, but is not guaranteed to be accurate and should be independently verified.
![]() IDX information is provided exclusively for consumers’ personal, non-commercial use, that it may not be used for any purpose other than to identify prospective properties consumers may be interested in purchasing, and that the data is deemed reliable but is not guaranteed accurate by the MLS. Licensor is only providing the MLS Content and not other sources of data provided in the Product.
IDX information is provided exclusively for consumers’ personal, non-commercial use, that it may not be used for any purpose other than to identify prospective properties consumers may be interested in purchasing, and that the data is deemed reliable but is not guaranteed accurate by the MLS. Licensor is only providing the MLS Content and not other sources of data provided in the Product.
Based on information from the Wasatch Front Regional Multiple Listing Service, Inc.. All data, including all measurements and calculations of area, is obtained from various sources and has not been, and will not be, verified by broker or the MLS. All information should be independently reviewed and verified for accuracy. Properties may or may not be listed by the office/agent presenting the information.
- 488 N 700 W
- 467 N 500 W
- 403 N 800 W
- 736 W 325 N
- 259 W 925 N
- 259 W 925 N Unit I52
- 319 N 800 W
- 262 W 800 N
- 507 N 200 W
- 1422 N 250 W Unit 59
- 1080 N 575 W
- 1062 N 550 W
- 965 N 200 W Unit U330
- 969 N 200 W Unit U329
- 682 N 300 W
- 271 W 925 N Unit I55
- 267 W 925 N
- 247 W 925 N Unit I49
- 266 W 925 N Unit O79
- 243 W 925 N Unit I48