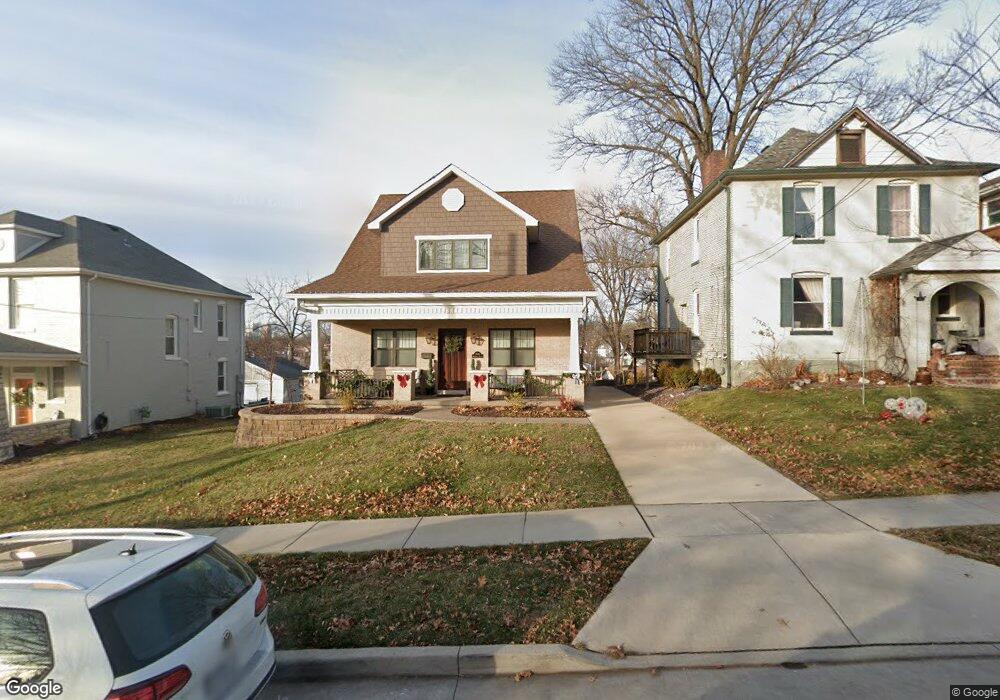
7481 Hiawatha Ave Saint Louis, MO 63117
Estimated Value: $505,000 - $635,000
3
Beds
4
Baths
2,261
Sq Ft
$258/Sq Ft
Est. Value
About This Home
This home is located at 7481 Hiawatha Ave, Saint Louis, MO 63117 and is currently estimated at $584,083, approximately $258 per square foot. 7481 Hiawatha Ave is a home located in St. Louis County with nearby schools including Maplewood Richmond Heights Elementary School, Maplewood Richmond Heights Middle School, and Maplewood-Richmond Heights High School.
Ownership History
Date
Name
Owned For
Owner Type
Purchase Details
Closed on
Jul 14, 2020
Sold by
Symonds Kyle R
Bought by
Kyle R Symonds Revocable Trust
Current Estimated Value
Home Financials for this Owner
Home Financials are based on the most recent Mortgage that was taken out on this home.
Original Mortgage
$283,000
Outstanding Balance
$250,475
Interest Rate
3%
Mortgage Type
New Conventional
Estimated Equity
$333,608
Purchase Details
Closed on
Dec 23, 2016
Sold by
Porter Dean B
Bought by
Symonds Kyle R
Home Financials for this Owner
Home Financials are based on the most recent Mortgage that was taken out on this home.
Original Mortgage
$304,000
Interest Rate
3.57%
Mortgage Type
New Conventional
Purchase Details
Closed on
Nov 17, 2015
Sold by
Foley Benjamin
Bought by
Porter Dean B
Purchase Details
Closed on
Jun 27, 2007
Sold by
Spectrum Residential Holdings Llc
Bought by
Foley Benjamin
Create a Home Valuation Report for This Property
The Home Valuation Report is an in-depth analysis detailing your home's value as well as a comparison with similar homes in the area
Home Values in the Area
Average Home Value in this Area
Purchase History
| Date | Buyer | Sale Price | Title Company |
|---|---|---|---|
| Kyle R Symonds Revocable Trust | -- | Arch City Title | |
| Symonds Kyle R | $380,000 | Continental Title | |
| Porter Dean B | -- | Investors Title Co Clayton | |
| Foley Benjamin | $37,500 | Ort |
Source: Public Records
Mortgage History
| Date | Status | Borrower | Loan Amount |
|---|---|---|---|
| Open | Kyle R Symonds Revocable Trust | $283,000 | |
| Closed | Symonds Kyle R | $304,000 |
Source: Public Records
Tax History Compared to Growth
Tax History
| Year | Tax Paid | Tax Assessment Tax Assessment Total Assessment is a certain percentage of the fair market value that is determined by local assessors to be the total taxable value of land and additions on the property. | Land | Improvement |
|---|---|---|---|---|
| 2025 | $7,124 | $114,530 | $34,710 | $79,820 |
| 2024 | $7,124 | $93,390 | $19,950 | $73,440 |
| 2023 | $7,061 | $93,390 | $19,950 | $73,440 |
| 2022 | $7,284 | $89,030 | $23,940 | $65,090 |
| 2021 | $7,157 | $89,030 | $23,940 | $65,090 |
| 2020 | $6,949 | $81,950 | $21,620 | $60,330 |
| 2019 | $6,894 | $81,950 | $21,620 | $60,330 |
| 2018 | $5,937 | $63,990 | $12,580 | $51,410 |
| 2017 | $5,896 | $63,990 | $12,580 | $51,410 |
| 2016 | $1,104 | $11,630 | $11,630 | $0 |
| 2015 | $1,036 | $11,630 | $11,630 | $0 |
| 2014 | $628 | $7,030 | $7,030 | $0 |
Source: Public Records
Map
Nearby Homes
- 1723 Mccready Ave
- 7572 Hiawatha Ave
- 1425 Silverton Place
- 7590 W Bruno Ave
- 7400 Williams Ave
- 7615 W Bruno Ave
- 7569 Dale Ave
- 7555 Alicia Ave
- 1323 Woodland Dr
- 1319 Woodland Dr
- 2011 Alameda Ave
- 7342 Dale Ave
- 1338 Sunset Ave
- 7765 Weston Place
- 2024 Bellevue Ave
- 7718 W Ranken Ave
- 7715 Dale Ave
- 7723 Dale Ave
- 1717 Yale Ave
- 1623 Yale Ave
- 7481 Hiawatha Tbb
- 7481TBB Hiawatha
- 7479 Hiawatha Ave
- 7475 Hiawatha Ave
- 7469 Hiawatha Ave
- 1612 S Big Bend Blvd
- 1610 S Big Bend Blvd
- 1711 Boneta Ave
- 1608 S Big Bend Blvd
- 7464 Arlington Dr
- 7468 Arlington Dr
- 7472 Arlington Dr
- 1606 S Big Bend Blvd
- 7460 Arlington Dr
- 1713 Boneta Ave
- 7461 Hiawatha Ave
- 1602 S Big Bend Blvd
- 7456 Arlington Dr
- 1715 Boneta Ave
- 7452 Arlington Dr