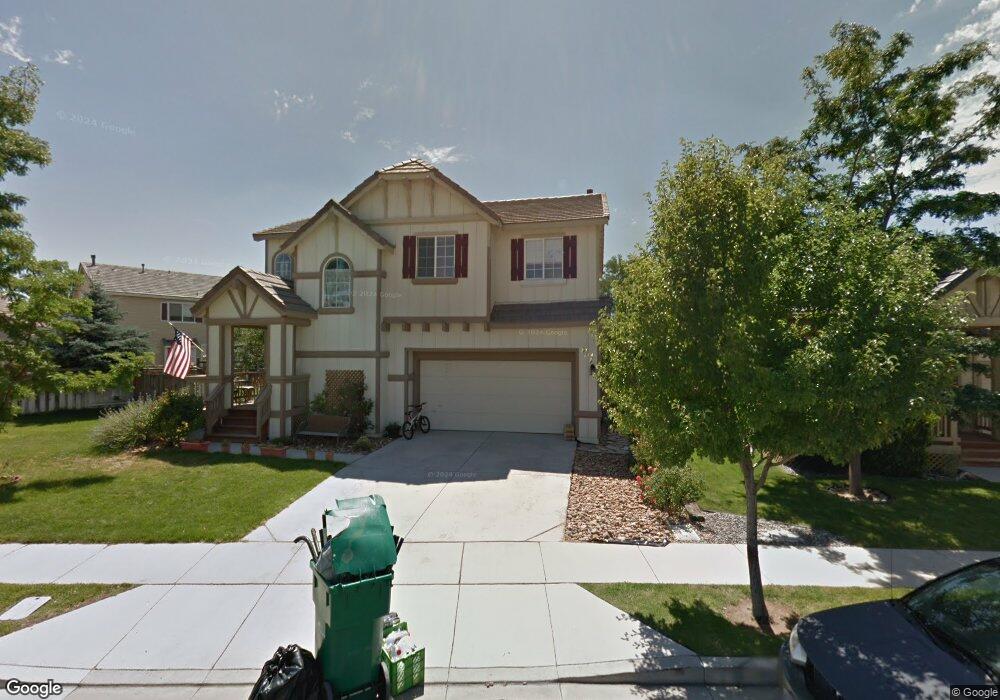
7485 S Florentine Dr Sparks, NV 89436
Wingfield Springs NeighborhoodEstimated Value: $513,901 - $556,000
3
Beds
3
Baths
1,825
Sq Ft
$289/Sq Ft
Est. Value
About This Home
This home is located at 7485 S Florentine Dr, Sparks, NV 89436 and is currently estimated at $526,975, approximately $288 per square foot. 7485 S Florentine Dr is a home located in Washoe County with nearby schools including Southern Elementary School, Van Gorder Elementary School, and Sky Ranch Middle School.
Ownership History
Date
Name
Owned For
Owner Type
Purchase Details
Closed on
Sep 27, 2017
Sold by
Mahone Richard A and Mahone Kathleen A
Bought by
Mahone Kathleen A
Current Estimated Value
Home Financials for this Owner
Home Financials are based on the most recent Mortgage that was taken out on this home.
Original Mortgage
$176,800
Outstanding Balance
$146,931
Interest Rate
3.9%
Mortgage Type
New Conventional
Estimated Equity
$380,044
Purchase Details
Closed on
Mar 14, 1999
Sold by
Saddlebrook 97 Lp
Bought by
Mahone Richard A and Mahone Kathleen A
Home Financials for this Owner
Home Financials are based on the most recent Mortgage that was taken out on this home.
Original Mortgage
$168,000
Interest Rate
7.2%
Mortgage Type
Balloon
Create a Home Valuation Report for This Property
The Home Valuation Report is an in-depth analysis detailing your home's value as well as a comparison with similar homes in the area
Home Values in the Area
Average Home Value in this Area
Purchase History
| Date | Buyer | Sale Price | Title Company |
|---|---|---|---|
| Mahone Kathleen A | $430,000 | None Available | |
| Mahone Richard A | $179,000 | First American Title Co |
Source: Public Records
Mortgage History
| Date | Status | Borrower | Loan Amount |
|---|---|---|---|
| Open | Mahone Kathleen A | $176,800 | |
| Previous Owner | Mahone Richard A | $168,000 |
Source: Public Records
Tax History Compared to Growth
Tax History
| Year | Tax Paid | Tax Assessment Tax Assessment Total Assessment is a certain percentage of the fair market value that is determined by local assessors to be the total taxable value of land and additions on the property. | Land | Improvement |
|---|---|---|---|---|
| 2026 | $1,778 | $107,467 | $39,270 | $68,197 |
| 2025 | $2,306 | $104,164 | $34,650 | $69,514 |
| 2024 | $2,306 | $99,835 | $29,715 | $70,120 |
| 2023 | $1,627 | $101,252 | $34,055 | $67,197 |
| 2022 | $2,176 | $83,827 | $27,720 | $56,107 |
| 2021 | $2,114 | $80,013 | $24,115 | $55,898 |
| 2020 | $2,050 | $78,993 | $22,890 | $56,103 |
| 2019 | $1,991 | $76,647 | $22,505 | $54,142 |
| 2018 | $1,933 | $70,074 | $16,940 | $53,134 |
| 2017 | $1,876 | $68,969 | $15,715 | $53,254 |
| 2016 | $1,829 | $67,007 | $13,650 | $53,357 |
| 2015 | $1,826 | $66,908 | $12,670 | $54,238 |
| 2014 | $1,773 | $63,275 | $11,235 | $52,040 |
| 2013 | -- | $46,708 | $8,155 | $38,553 |
Source: Public Records
Map
Nearby Homes
- 7366 Grand Island Dr
- 3149 Gladiola Ct
- 7311 S Florentine Dr Unit 10A
- 7240 Silver King Dr
- 7315 Silver King Dr
- 3245 Gerona Ct
- 2850 Billie Dove Ct
- 7766 Corneta Ct
- 2850 Friar Rock Ct
- 2750 Arrow Smith Dr
- 2880 Friar Rock Ct
- 7476 Lorna Ln
- 7778 Cerritos Cir Unit 7
- 7859 Guerra Ct
- 7842 Alcandre Ct
- 3716 Early Dawn Dr
- 7850 Morro Ave
- 7718 Rhythm Cir
- 7260 Treeline Ct
- 7464 Europa Dr
- 7495 S Florentine Dr
- 7430 Ambush Cir
- 7410 Ambush Cir
- 7450 Ambush Cir
- 7505 S Florentine Dr
- 7470 Ambush Cir
- 7490 Ambush Cir
- 7490 S Florentine Dr
- 7480 S Florentine Dr
- 7515 S Florentine Dr
- 7500 S Florentine Dr
- 7510 Ambush Cir
- 7510 S Florentine Dr
- 7530 Ambush Cir
- 7560 Ambush Cir
- 7439 Ambush Cir Unit 10B
- 7429 Ambush Cir
- 7520 S Florentine Dr
- 7411 Ambush Cir
- 7459 Ambush Cir