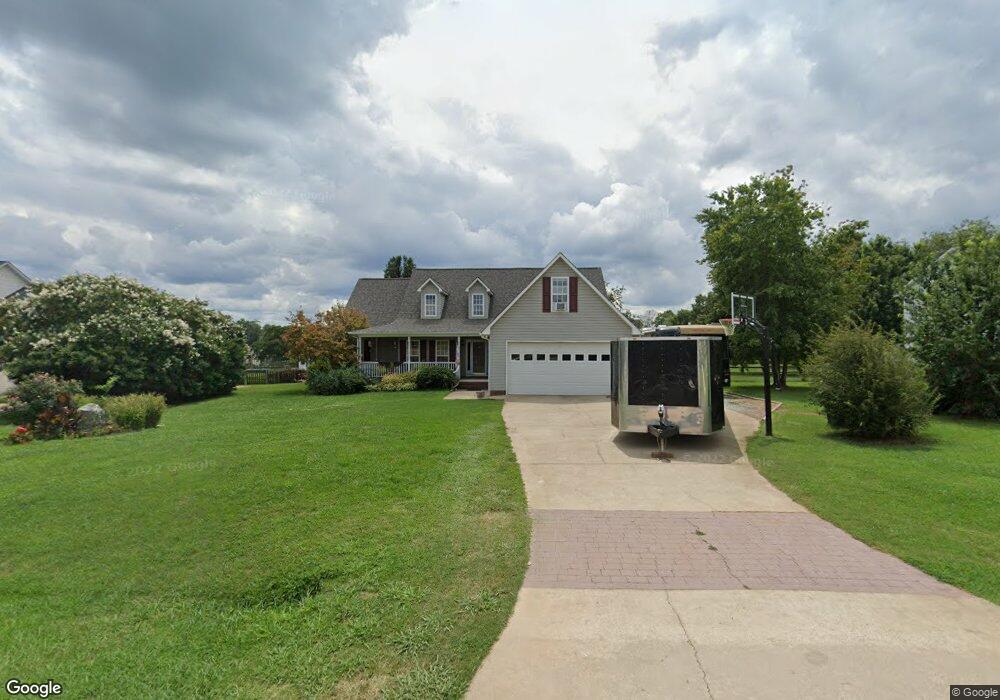
749 Cress School Rd Salisbury, NC 28147
Estimated Value: $365,000 - $434,000
3
Beds
2
Baths
2,005
Sq Ft
$196/Sq Ft
Est. Value
About This Home
This home is located at 749 Cress School Rd, Salisbury, NC 28147 and is currently estimated at $393,075, approximately $196 per square foot. 749 Cress School Rd is a home located in Rowan County with nearby schools including Knollwood Elementary School, Southeast Middle School, and Jesse C Carson High School.
Ownership History
Date
Name
Owned For
Owner Type
Purchase Details
Closed on
Oct 28, 2010
Sold by
Steen Blake and Steen Kathryn
Bought by
Polce Antonio S and Polce Jennifer M
Current Estimated Value
Home Financials for this Owner
Home Financials are based on the most recent Mortgage that was taken out on this home.
Original Mortgage
$139,600
Outstanding Balance
$92,574
Interest Rate
4.37%
Mortgage Type
New Conventional
Estimated Equity
$300,501
Purchase Details
Closed on
Nov 21, 2005
Sold by
Aminuddin Norman and Aminuddin Jennifer T
Bought by
Steen Blake and Steen Kathryn
Home Financials for this Owner
Home Financials are based on the most recent Mortgage that was taken out on this home.
Original Mortgage
$140,800
Interest Rate
6.21%
Mortgage Type
Fannie Mae Freddie Mac
Create a Home Valuation Report for This Property
The Home Valuation Report is an in-depth analysis detailing your home's value as well as a comparison with similar homes in the area
Purchase History
| Date | Buyer | Sale Price | Title Company |
|---|---|---|---|
| Polce Antonio S | $174,500 | None Available | |
| Steen Blake | $176,000 | None Available |
Source: Public Records
Mortgage History
| Date | Status | Borrower | Loan Amount |
|---|---|---|---|
| Open | Polce Antonio S | $139,600 | |
| Closed | Polce Antonio S | $17,450 | |
| Previous Owner | Steen Blake | $26,400 | |
| Previous Owner | Steen Blake | $140,800 |
Source: Public Records
Tax History
| Year | Tax Paid | Tax Assessment Tax Assessment Total Assessment is a certain percentage of the fair market value that is determined by local assessors to be the total taxable value of land and additions on the property. | Land | Improvement |
|---|---|---|---|---|
| 2025 | $2,085 | $307,814 | $37,500 | $270,314 |
| 2024 | $2,085 | $307,814 | $37,500 | $270,314 |
| 2023 | $2,085 | $307,814 | $37,500 | $270,314 |
| 2022 | $1,504 | $199,234 | $32,000 | $167,234 |
| 2021 | $1,489 | $199,234 | $32,000 | $167,234 |
| 2020 | $1,489 | $199,234 | $32,000 | $167,234 |
| 2019 | $1,489 | $199,234 | $32,000 | $167,234 |
| 2018 | $1,149 | $154,958 | $28,500 | $126,458 |
| 2017 | $1,149 | $154,958 | $28,500 | $126,458 |
| 2016 | $1,149 | $154,958 | $28,500 | $126,458 |
| 2015 | $1,162 | $154,958 | $28,500 | $126,458 |
| 2014 | $1,119 | $156,559 | $28,500 | $128,059 |
Source: Public Records
Map
Nearby Homes
- 688 Cress School Rd
- 462 Cress Loop Rd
- 132 Chelton Ct
- 143 Maple Ridge Cir
- 2740 Hill Top Dr
- 130 Lois Ln
- 895 Cooper Rd
- 397 Bramblewood Dr Unit 50
- 328 Bramblewood Dr
- 0 Patrick Dr
- 6255 Meadow Ln
- 4115 Miller Rd
- 523 Hickory Nut Ln
- 0 Shue Rd
- 1910 Cooper Rd
- 1348 Greenheather Dr
- 555 White Hare Ln Unit 80p
- 798 Wilson St
- 460 Black Bear St Unit 148p
- 2570 Lipe Rd
- 767 Cress School Rd
- 729 Cress School Rd
- 785 Cress School Rd
- 1111 Foxbrook Place
- 705 Cress School Rd
- 1085 Foxbrook Place
- 776 Cress School Rd
- 812 Cress School Rd
- 812 Cress School Rd Unit 113
- 801 Cress School Rd
- 1061 Foxbrook Place
- 752 Cress School Rd
- 1117 Foxbrook Place
- 683 Cress School Rd
- 836 Cress School Rd
- 1037 Foxbrook Place
- 732 Cress School Rd
- 821 Cress School Rd
- 873 Cress School Rd
- 860 Cress School Rd
Your Personal Tour Guide
Ask me questions while you tour the home.