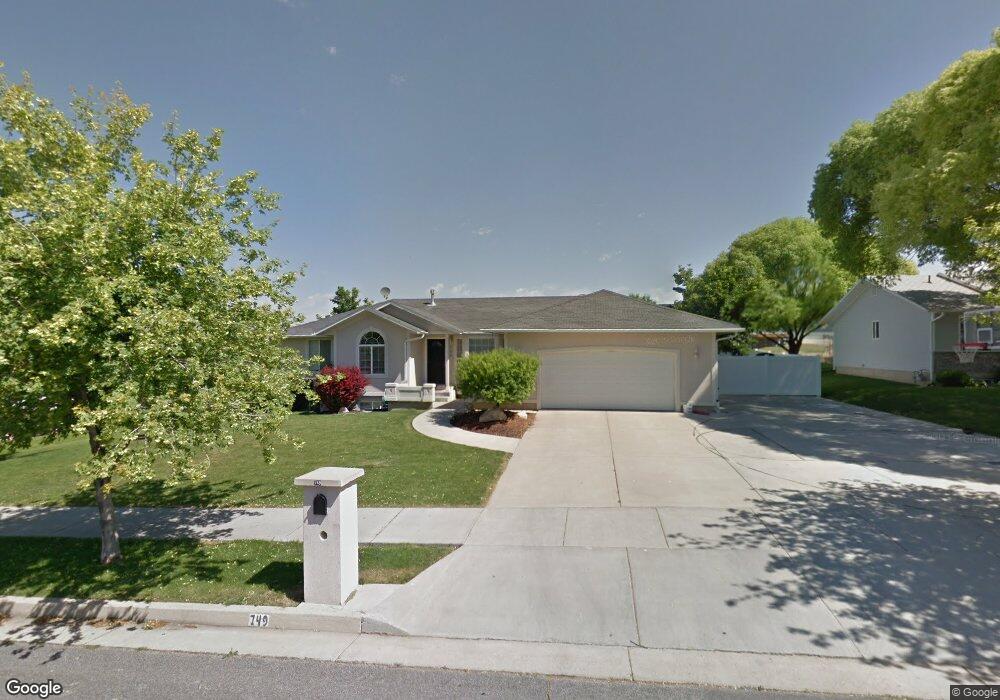
749 E 530 S Smithfield, UT 84335
Estimated Value: $438,000 - $501,000
4
Beds
3
Baths
2,545
Sq Ft
$179/Sq Ft
Est. Value
About This Home
This home is located at 749 E 530 S, Smithfield, UT 84335 and is currently estimated at $455,712, approximately $179 per square foot. 749 E 530 S is a home located in Cache County with nearby schools including Sunrise School, Cedar Ridge School, and North Cache Middle School.
Ownership History
Date
Name
Owned For
Owner Type
Purchase Details
Closed on
May 8, 2013
Sold by
Simon Evan M and Simon Linda Kyte
Bought by
Humpherys Darin Robert and Humpherys Amber
Current Estimated Value
Home Financials for this Owner
Home Financials are based on the most recent Mortgage that was taken out on this home.
Original Mortgage
$172,500
Outstanding Balance
$35,373
Interest Rate
3.5%
Mortgage Type
New Conventional
Estimated Equity
$420,339
Purchase Details
Closed on
Mar 28, 2012
Sold by
Simon Evan M
Bought by
Simon Evan M and Simon Linda Kyte
Home Financials for this Owner
Home Financials are based on the most recent Mortgage that was taken out on this home.
Original Mortgage
$204,081
Interest Rate
3.83%
Mortgage Type
New Conventional
Create a Home Valuation Report for This Property
The Home Valuation Report is an in-depth analysis detailing your home's value as well as a comparison with similar homes in the area
Home Values in the Area
Average Home Value in this Area
Purchase History
| Date | Buyer | Sale Price | Title Company |
|---|---|---|---|
| Humpherys Darin Robert | -- | Advanced Title | |
| Simon Evan M | -- | Hickman Land Title Company | |
| Simon Evan M | -- | Hickman Land Title Company |
Source: Public Records
Mortgage History
| Date | Status | Borrower | Loan Amount |
|---|---|---|---|
| Open | Humpherys Darin Robert | $172,500 | |
| Previous Owner | Simon Evan M | $204,081 |
Source: Public Records
Tax History
| Year | Tax Paid | Tax Assessment Tax Assessment Total Assessment is a certain percentage of the fair market value that is determined by local assessors to be the total taxable value of land and additions on the property. | Land | Improvement |
|---|---|---|---|---|
| 2025 | $1,734 | $232,105 | $0 | $0 |
| 2024 | $1,723 | $216,360 | $0 | $0 |
| 2023 | $1,802 | $214,065 | $0 | $0 |
| 2022 | $1,832 | $214,070 | $0 | $0 |
| 2021 | $1,828 | $326,370 | $75,000 | $251,370 |
| 2020 | $1,638 | $272,846 | $75,000 | $197,846 |
| 2019 | $1,612 | $255,846 | $58,000 | $197,846 |
| 2018 | $1,498 | $230,040 | $58,000 | $172,040 |
| 2017 | $1,406 | $117,920 | $0 | $0 |
| 2016 | $1,431 | $117,920 | $0 | $0 |
| 2015 | $1,329 | $109,065 | $0 | $0 |
| 2014 | $1,306 | $109,340 | $0 | $0 |
| 2013 | -- | $109,340 | $0 | $0 |
Source: Public Records
Map
Nearby Homes
- 781 E 450 S
- 127 S 830 E Unit 304
- 462 E 520 S
- 396 S 455 E
- 991 E 300 S
- 641 S 1080 E Unit 44
- 1092 E 300 S
- 628 S 1080 E
- 390 S 1100 E
- 577 S 1140 E Unit 1202
- 89 N 1140 E Unit 74
- 589 S 1140 E Unit 1201
- 413 S 1150 E Unit 1101
- 372 S 1150 E Unit 607
- 350 E 400 S
- 260 S 370 E
- 776 S 1150 E
- 738 S 1150 E Unit 9
- 12 S 1150 E Unit 8
- 65 Chateau Way
Your Personal Tour Guide
Ask me questions while you tour the home.