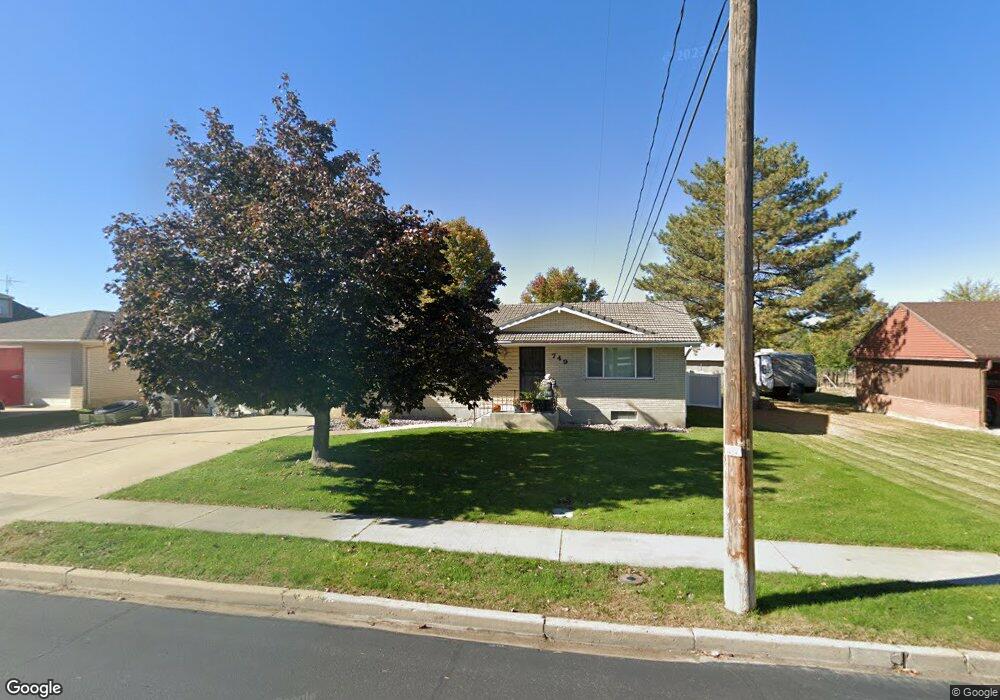
749 N 100 W Spanish Fork, UT 84660
Estimated Value: $437,000 - $507,000
3
Beds
3
Baths
1,204
Sq Ft
$388/Sq Ft
Est. Value
About This Home
This home is located at 749 N 100 W, Spanish Fork, UT 84660 and is currently estimated at $467,209, approximately $388 per square foot. 749 N 100 W is a home located in Utah County with nearby schools including Brockbank Elementary School, Spanish Fork Jr High School, and Spanish Fork High School.
Ownership History
Date
Name
Owned For
Owner Type
Purchase Details
Closed on
Jan 22, 2019
Sold by
M And N Swenson Properties Llc
Bought by
Hansen Tyler
Current Estimated Value
Home Financials for this Owner
Home Financials are based on the most recent Mortgage that was taken out on this home.
Original Mortgage
$232,000
Outstanding Balance
$203,975
Interest Rate
4.6%
Mortgage Type
New Conventional
Estimated Equity
$263,234
Purchase Details
Closed on
Jun 27, 2013
Sold by
Swenson Nancy and Thomas J Phillips Trust
Bought by
M & N Swenson Properties Llc
Purchase Details
Closed on
Apr 17, 2013
Sold by
Phillips Thomas J and Thomas J Phillips Trust
Bought by
Phillips Thomas J and Swenson Nancy
Purchase Details
Closed on
Oct 23, 2009
Sold by
Phillips Thomas J
Bought by
Phillips Thomas J and Thomas J Phillips Trust
Create a Home Valuation Report for This Property
The Home Valuation Report is an in-depth analysis detailing your home's value as well as a comparison with similar homes in the area
Home Values in the Area
Average Home Value in this Area
Purchase History
| Date | Buyer | Sale Price | Title Company |
|---|---|---|---|
| Hansen Tyler | -- | Wasatch Land & Title | |
| M & N Swenson Properties Llc | -- | None Available | |
| Phillips Thomas J | -- | None Available | |
| Phillips Thomas J | -- | None Available |
Source: Public Records
Mortgage History
| Date | Status | Borrower | Loan Amount |
|---|---|---|---|
| Open | Hansen Tyler | $232,000 |
Source: Public Records
Tax History Compared to Growth
Tax History
| Year | Tax Paid | Tax Assessment Tax Assessment Total Assessment is a certain percentage of the fair market value that is determined by local assessors to be the total taxable value of land and additions on the property. | Land | Improvement |
|---|---|---|---|---|
| 2025 | $2,064 | $245,465 | $151,700 | $294,600 |
| 2024 | $2,064 | $212,740 | $0 | $0 |
| 2023 | $2,032 | $209,660 | $0 | $0 |
| 2022 | $2,375 | $240,405 | $0 | $0 |
| 2021 | $2,106 | $341,000 | $88,000 | $253,000 |
| 2020 | $1,914 | $301,200 | $73,300 | $227,900 |
| 2019 | $1,639 | $271,500 | $73,300 | $198,200 |
| 2018 | $1,549 | $247,900 | $73,300 | $174,600 |
| 2017 | $1,382 | $118,910 | $0 | $0 |
| 2016 | $1,194 | $101,365 | $0 | $0 |
| 2015 | $1,082 | $90,805 | $0 | $0 |
| 2014 | $988 | $83,160 | $0 | $0 |
Source: Public Records
Map
Nearby Homes