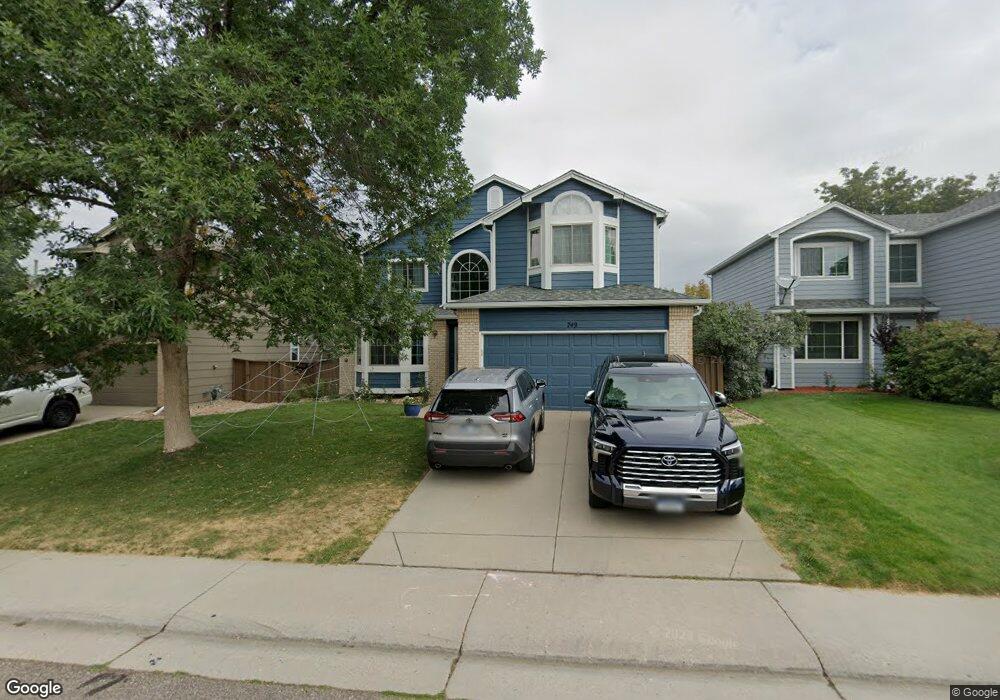
749 Redwood Ct Highlands Ranch, CO 80126
Northridge NeighborhoodEstimated Value: $690,710 - $767,000
4
Beds
3
Baths
3,432
Sq Ft
$217/Sq Ft
Est. Value
About This Home
This home is located at 749 Redwood Ct, Highlands Ranch, CO 80126 and is currently estimated at $745,178, approximately $217 per square foot. 749 Redwood Ct is a home located in Douglas County with nearby schools including Bear Canyon Elementary School, Mountain Ridge Middle School, and Mountain Vista High School.
Ownership History
Date
Name
Owned For
Owner Type
Purchase Details
Closed on
Jun 8, 2015
Sold by
Kathryn D Neely Trust
Bought by
Geiger Paul D and Geiger Stephanie
Current Estimated Value
Home Financials for this Owner
Home Financials are based on the most recent Mortgage that was taken out on this home.
Original Mortgage
$373,422
Outstanding Balance
$286,621
Interest Rate
3.5%
Mortgage Type
FHA
Estimated Equity
$458,557
Purchase Details
Closed on
Nov 6, 2007
Sold by
Neely Living Trust
Bought by
Neely Kathryn D
Purchase Details
Closed on
Sep 18, 2007
Sold by
Neely Kathryn D
Bought by
Kathryn D Neely Trust
Purchase Details
Closed on
Sep 16, 2005
Sold by
Neely Living Trust
Bought by
Neely Kathryn D
Purchase Details
Closed on
Oct 2, 2003
Sold by
Neely Harold Lee and Neely Kathryn D
Bought by
Neely Living Trust
Purchase Details
Closed on
Dec 18, 1992
Sold by
Richmond Homes Inc Ii
Bought by
Neely Harold Lee and Neely Kathryn D
Purchase Details
Closed on
Jun 15, 1992
Sold by
Mission Viejo Co
Bought by
Richmond Homes Inc Ii
Create a Home Valuation Report for This Property
The Home Valuation Report is an in-depth analysis detailing your home's value as well as a comparison with similar homes in the area
Home Values in the Area
Average Home Value in this Area
Purchase History
| Date | Buyer | Sale Price | Title Company |
|---|---|---|---|
| Geiger Paul D | $407,000 | -- | |
| Neely Kathryn D | -- | -- | |
| Kathryn D Neely Trust | -- | None Available | |
| Neely Kathryn D | -- | -- | |
| Neely Living Trust | -- | -- | |
| Neely Harold Lee | $159,100 | -- | |
| Richmond Homes Inc Ii | $74,100 | -- |
Source: Public Records
Mortgage History
| Date | Status | Borrower | Loan Amount |
|---|---|---|---|
| Open | Geiger Paul D | $373,422 |
Source: Public Records
Tax History Compared to Growth
Tax History
| Year | Tax Paid | Tax Assessment Tax Assessment Total Assessment is a certain percentage of the fair market value that is determined by local assessors to be the total taxable value of land and additions on the property. | Land | Improvement |
|---|---|---|---|---|
| 2024 | $4,639 | $52,900 | $9,480 | $43,420 |
| 2023 | $4,631 | $52,900 | $9,480 | $43,420 |
| 2022 | $3,319 | $36,330 | $6,500 | $29,830 |
| 2021 | $3,453 | $36,330 | $6,500 | $29,830 |
| 2020 | $3,025 | $32,620 | $6,180 | $26,440 |
| 2019 | $3,037 | $32,620 | $6,180 | $26,440 |
| 2018 | $2,855 | $30,210 | $5,440 | $24,770 |
| 2017 | $2,600 | $30,210 | $5,440 | $24,770 |
| 2016 | $2,308 | $26,320 | $4,780 | $21,540 |
| 2015 | $1,644 | $26,320 | $4,780 | $21,540 |
| 2014 | $1,335 | $21,720 | $5,570 | $16,150 |
Source: Public Records
Map
Nearby Homes
- 768 Poppywood Place
- 9823 Salford Ln
- 638 E Huntington Place
- 9808 Isabel Ct
- 9788 Isabel Ct
- 9750 Red Oakes Dr
- 10041 Hughes Way
- 291 Fairchild Dr
- 141 Fairchild Place
- 146 Estack Place
- 1211 Michener Way
- 9717 Red Oakes Place
- 10258 Pennington Ln
- 10141 Autumn Blaze Trail
- 745 Stowe St
- 10164 Autumn Blaze Trail
- 9791 Sterling Dr
- 818 Summer Dr Unit 7D
- 795 Ridgemont Cir
- 760 Ridgemont Cir
- 759 Redwood Ct
- 739 Redwood Ct
- 769 Redwood Ct
- 719 Redwood Ct
- 769 E Redwood Ct
- 738 Poppywood Place
- 779 Redwood Ct
- 760 E Redwood Ct
- 709 Redwood Ct
- 760 Redwood Ct
- 750 Redwood Ct
- 770 Redwood Ct
- 740 Redwood Ct
- 789 Redwood Ct
- 718 Poppywood Place
- 730 Redwood Ct
- 780 Redwood Ct
- 778 Poppywood Place
- 720 Redwood Ct
- 799 Redwood Ct