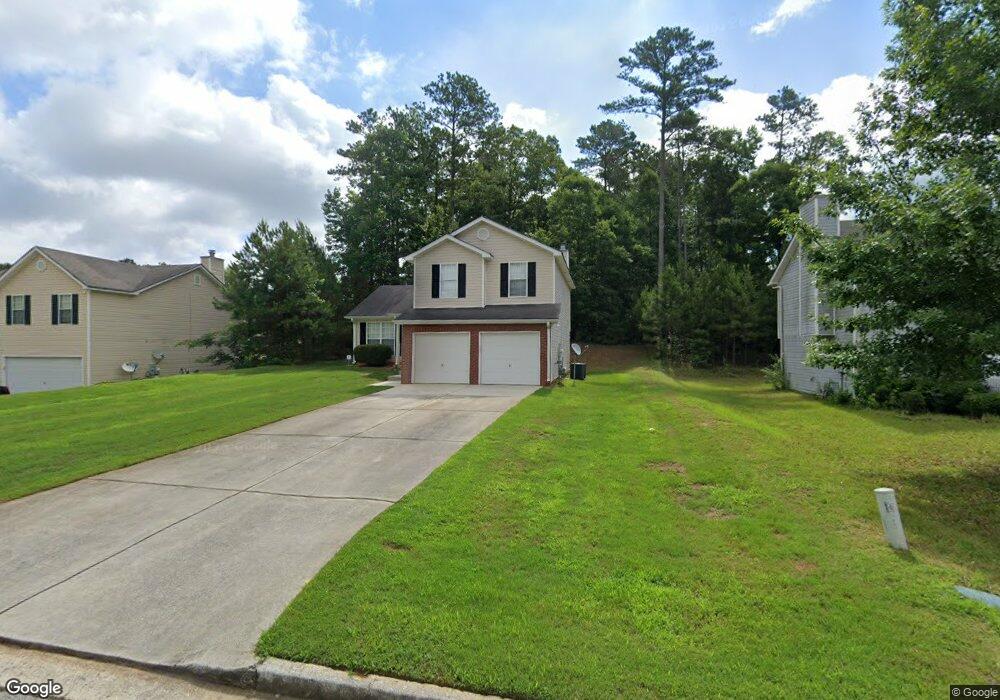
749 Sinclair Way Jonesboro, GA 30238
Estimated Value: $240,468 - $259,000
3
Beds
3
Baths
1,624
Sq Ft
$155/Sq Ft
Est. Value
About This Home
This home is located at 749 Sinclair Way, Jonesboro, GA 30238 and is currently estimated at $252,117, approximately $155 per square foot. 749 Sinclair Way is a home located in Clayton County with nearby schools including Hawthorne Elementary School, Lovejoy Middle School, and Eddie White Academy.
Ownership History
Date
Name
Owned For
Owner Type
Purchase Details
Closed on
May 25, 2023
Sold by
Woodley-Tyehimb Allison T
Bought by
Allisons Revocable Trust Ua Dated 25Th M
Current Estimated Value
Purchase Details
Closed on
Jun 23, 2019
Sold by
Reed Allison
Bought by
Woodley-Tyehimb Allison T and Reed Brianna Leigh
Purchase Details
Closed on
Dec 19, 2003
Sold by
Hud
Bought by
Reed Allison
Home Financials for this Owner
Home Financials are based on the most recent Mortgage that was taken out on this home.
Original Mortgage
$113,223
Interest Rate
5.82%
Mortgage Type
VA
Purchase Details
Closed on
Aug 5, 2003
Sold by
Chase Manhattan Mtg
Bought by
Hud
Purchase Details
Closed on
Apr 18, 2002
Sold by
First Dimension Homes Inc
Bought by
King Katherine A and King Michael R
Home Financials for this Owner
Home Financials are based on the most recent Mortgage that was taken out on this home.
Original Mortgage
$123,500
Interest Rate
6.98%
Mortgage Type
FHA
Create a Home Valuation Report for This Property
The Home Valuation Report is an in-depth analysis detailing your home's value as well as a comparison with similar homes in the area
Home Values in the Area
Average Home Value in this Area
Purchase History
| Date | Buyer | Sale Price | Title Company |
|---|---|---|---|
| Allisons Revocable Trust Ua Dated 25Th M | -- | -- | |
| Woodley-Tyehimb Allison T | $137,566 | -- | |
| Reed Allison | -- | -- | |
| Hud | -- | -- | |
| Chase Manhattan Mtg | $128,964 | -- | |
| King Katherine A | $125,500 | -- |
Source: Public Records
Mortgage History
| Date | Status | Borrower | Loan Amount |
|---|---|---|---|
| Previous Owner | Reed Allison | $113,223 | |
| Previous Owner | King Katherine A | $123,500 |
Source: Public Records
Tax History Compared to Growth
Tax History
| Year | Tax Paid | Tax Assessment Tax Assessment Total Assessment is a certain percentage of the fair market value that is determined by local assessors to be the total taxable value of land and additions on the property. | Land | Improvement |
|---|---|---|---|---|
| 2025 | $3,902 | $100,880 | $8,800 | $92,080 |
| 2024 | $3,663 | $92,920 | $8,800 | $84,120 |
| 2023 | $3,716 | $101,880 | $8,800 | $93,080 |
| 2022 | $3,490 | $87,960 | $8,800 | $79,160 |
| 2021 | $2,473 | $61,640 | $8,800 | $52,840 |
| 2020 | $2,322 | $57,104 | $8,800 | $48,304 |
| 2019 | $2,035 | $49,199 | $7,200 | $41,999 |
| 2018 | $1,848 | $44,592 | $7,200 | $37,392 |
| 2017 | $1,377 | $32,914 | $7,200 | $25,714 |
| 2016 | $1,377 | $32,914 | $7,200 | $25,714 |
| 2015 | $1,203 | $0 | $0 | $0 |
| 2014 | $799 | $29,110 | $7,200 | $21,910 |
Source: Public Records
Map
Nearby Homes
- 800 Sinclair Way
- LOT Hunter Ridge Dr
- 696 Tara Rd
- 10411 Ivygate Terrace
- 10588 Fitzgerald Rd
- 1157 Forest Glen
- 10283 Richfield Ct
- 10410 Iron Gate Ln
- 1036 Walnut Creek Ln
- 1117 Village Creek
- 1159 Bonita Way Unit 10
- 1224 Bonita Cir
- 366 Lead Way
- 10200 Commons Crossing Unit 1
- 1091 Commons Ct Unit 2
- 10779 Tara Village Way
- 10197 Hamilton Glen
- 338 Lead Way
- 9997 Point View Dr
- 1241 Larkwood Dr
- 741 Sinclair Way
- 757 Sinclair Way
- 795 Sinclair Way Unit 2
- 803 Sinclair Way
- 725 Sinclair Way
- 733 Sinclair Way
- 717 Sinclair Way
- 746 Sinclair Way
- 754 Sinclair Way Unit 2
- 811 Sinclair Way Unit 2
- 738 Sinclair Way Unit 2
- 762 Sinclair Way
- 766 Sinclair Way
- 784 Sinclair Way
- 709 Sinclair Way Unit 2
- 709 Sinclair Way Unit 102
- 730 Sinclair Way Unit 2
- 792 Sinclair Way
- 819 Sinclair Way
- 776 Sinclair Way