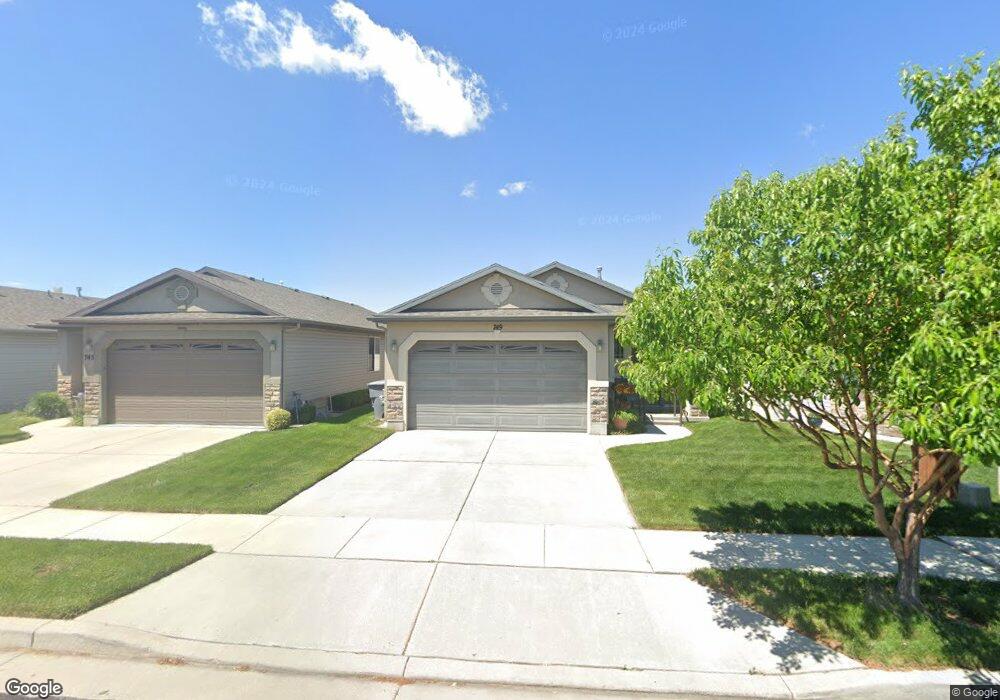
749 Skipton North Salt Lake, UT 84054
Estimated Value: $459,000 - $485,000
3
Beds
2
Baths
1,512
Sq Ft
$314/Sq Ft
Est. Value
About This Home
This home is located at 749 Skipton, North Salt Lake, UT 84054 and is currently estimated at $474,846, approximately $314 per square foot. 749 Skipton is a home located in Davis County with nearby schools including Foxboro School, Mueller Park Junior High School, and Bountiful High School.
Ownership History
Date
Name
Owned For
Owner Type
Purchase Details
Closed on
Nov 25, 2013
Sold by
Hoover Norma and Hoover Kelvin
Bought by
Hoover Kelvin L and Hoover Norma
Current Estimated Value
Purchase Details
Closed on
Nov 22, 2013
Sold by
Huffaker Nicholas T and Huffaker Shauna L
Bought by
Hoover Norma and Hoover Kelvin
Purchase Details
Closed on
Nov 27, 2006
Sold by
Foxboro Village Llc
Bought by
Huffaker Nicholas T and Huffaker Shauna L
Home Financials for this Owner
Home Financials are based on the most recent Mortgage that was taken out on this home.
Original Mortgage
$27,550
Interest Rate
6.05%
Mortgage Type
Stand Alone Second
Purchase Details
Closed on
May 19, 2006
Sold by
Portola Development Utah Lc
Bought by
Foxboro Villages Llc
Purchase Details
Closed on
Jun 28, 2005
Sold by
Portola Development Utah Lc
Bought by
South Davis Sewer District
Create a Home Valuation Report for This Property
The Home Valuation Report is an in-depth analysis detailing your home's value as well as a comparison with similar homes in the area
Home Values in the Area
Average Home Value in this Area
Purchase History
| Date | Buyer | Sale Price | Title Company |
|---|---|---|---|
| Hoover Kelvin L | -- | Alta Title Insurance | |
| Hoover Norma | -- | Alta Title Insurance | |
| Huffaker Nicholas T | -- | Us Title Company Of Utah | |
| Foxboro Villages Llc | -- | Accommodation | |
| South Davis Sewer District | -- | -- |
Source: Public Records
Mortgage History
| Date | Status | Borrower | Loan Amount |
|---|---|---|---|
| Previous Owner | Huffaker Nicholas T | $27,550 | |
| Previous Owner | Huffaker Nicholas T | $146,950 |
Source: Public Records
Tax History Compared to Growth
Tax History
| Year | Tax Paid | Tax Assessment Tax Assessment Total Assessment is a certain percentage of the fair market value that is determined by local assessors to be the total taxable value of land and additions on the property. | Land | Improvement |
|---|---|---|---|---|
| 2025 | $625 | $250,250 | $89,934 | $160,316 |
| 2024 | $625 | $245,850 | $92,025 | $153,825 |
| 2023 | $637 | $418,000 | $118,675 | $299,325 |
| 2022 | $675 | $239,800 | $51,771 | $188,029 |
| 2021 | $0 | $327,000 | $72,709 | $254,291 |
| 2020 | $1,902 | $285,000 | $62,127 | $222,873 |
| 2019 | $1,930 | $282,000 | $55,543 | $226,457 |
| 2018 | $1,750 | $253,000 | $50,494 | $202,506 |
| 2016 | $1,480 | $113,795 | $27,772 | $86,023 |
| 2015 | $1,472 | $108,735 | $27,772 | $80,963 |
| 2014 | $1,524 | $114,726 | $27,772 | $86,954 |
| 2013 | -- | $94,587 | $29,712 | $64,875 |
Source: Public Records
Map
Nearby Homes
- 741 N Skipton Dr
- 715 Leeds Ct
- 1127 W Haworth Dr
- 1072 W Stonehaven Dr
- 114 Birmingham Ln
- 1002 W Stonehaven Dr Unit 108
- 452 N Kent Ln
- 448 Kent Dr
- 433 Kent Dr
- 997 N Fox Hollow Dr
- 273 Birmingham Ln
- 940 W Stonehaven Dr
- 1147 Ethnie Ct
- 1052 Chidester Dr
- 920 W Stonehaven Dr
- 954 N Picadilly Ct
- 875 Walton Dr
- 928 Amberly Dr
- 967 Amberly Dr
- 979 Amberly Dr
- 745 Skipton
- 753 Skipton
- 742 N Skipton Dr
- 752 N Skipton Dr
- 738 N Skipton Dr
- 738 Skipton Dr W
- 738 N Skipton Dr
- 758 N Skipton Dr
- 758 N Skipton Dr
- 748 Skipton
- 752 Skipton
- 742 Skipton
- 739 Leeds Ct
- 732 N Skipton Dr
- 743 Leeds Ct
- 762 N Skipton Dr
- 762 N Skipton Dr
- 749 N Skipton Dr
- 745 N Skipton Dr
- 753 N Skipton Dr