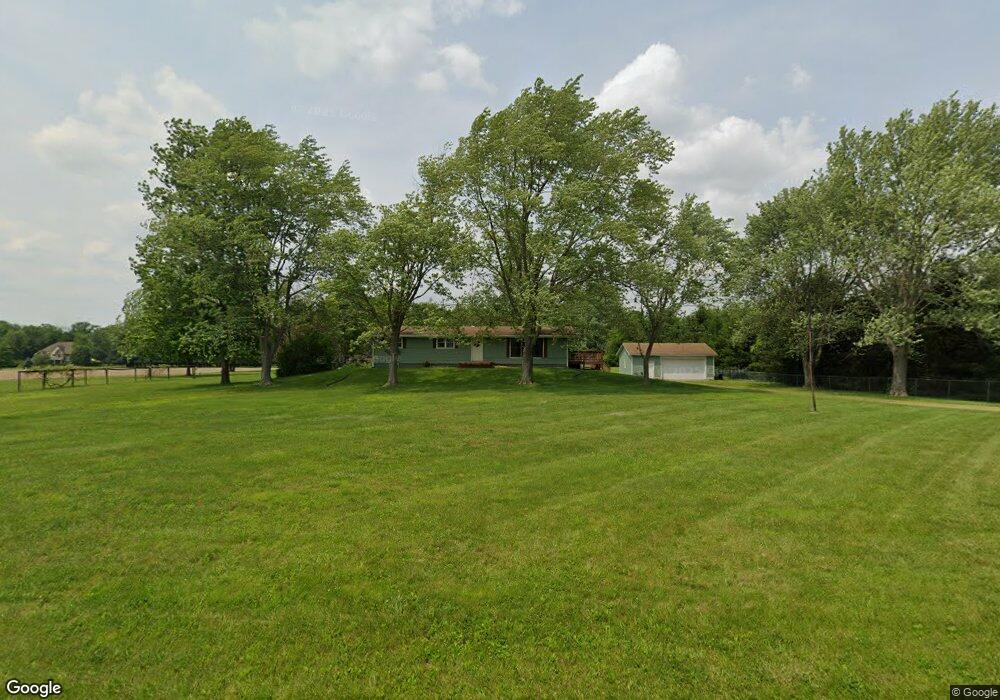
7492 E 50 N Franklin, IN 46131
Estimated Value: $444,000 - $514,000
4
Beds
3
Baths
1,408
Sq Ft
$337/Sq Ft
Est. Value
About This Home
This home is located at 7492 E 50 N, Franklin, IN 46131 and is currently estimated at $474,120, approximately $336 per square foot. 7492 E 50 N is a home located in Johnson County with nearby schools including Needham Elementary School, Franklin Community Middle School, and Custer Baker Intermediate School.
Ownership History
Date
Name
Owned For
Owner Type
Purchase Details
Closed on
Aug 29, 2021
Sold by
Davis William R
Bought by
Woodward Christopher G and Woodward Amanda K
Current Estimated Value
Purchase Details
Closed on
Aug 27, 2010
Sold by
Cole Mark A and Cole Whitney J
Bought by
Weeks Lewis W and Weeks Roxanne
Home Financials for this Owner
Home Financials are based on the most recent Mortgage that was taken out on this home.
Original Mortgage
$174,577
Interest Rate
4.54%
Mortgage Type
VA
Create a Home Valuation Report for This Property
The Home Valuation Report is an in-depth analysis detailing your home's value as well as a comparison with similar homes in the area
Home Values in the Area
Average Home Value in this Area
Purchase History
| Date | Buyer | Sale Price | Title Company |
|---|---|---|---|
| Woodward Christopher G | -- | None Available | |
| Weeks Lewis W | -- | None Available |
Source: Public Records
Mortgage History
| Date | Status | Borrower | Loan Amount |
|---|---|---|---|
| Previous Owner | Weeks Lewis W | $174,577 |
Source: Public Records
Tax History
| Year | Tax Paid | Tax Assessment Tax Assessment Total Assessment is a certain percentage of the fair market value that is determined by local assessors to be the total taxable value of land and additions on the property. | Land | Improvement |
|---|---|---|---|---|
| 2025 | $3,079 | $339,600 | $62,000 | $277,600 |
| 2024 | $3,079 | $290,600 | $62,000 | $228,600 |
| 2023 | $2,961 | $280,800 | $62,000 | $218,800 |
| 2022 | $3,439 | $281,100 | $62,000 | $219,100 |
| 2021 | $3,379 | $247,700 | $84,000 | $163,700 |
| 2020 | $3,011 | $221,600 | $80,000 | $141,600 |
| 2019 | $3,020 | $231,700 | $80,000 | $151,700 |
| 2018 | $2,691 | $222,200 | $80,000 | $142,200 |
| 2017 | $2,641 | $217,600 | $80,000 | $137,600 |
| 2016 | $2,319 | $206,100 | $80,000 | $126,100 |
| 2014 | $2,206 | $183,600 | $80,000 | $103,600 |
| 2013 | $2,206 | $183,200 | $80,000 | $103,200 |
Source: Public Records
Map
Nearby Homes
- W S 900 W
- 6227 E State Road 44
- 409 Paris Dr
- 2080 Fairway Lakes Dr
- 5495 E Greensburg Rd
- 863 S 450 E
- 1810 E Jefferson St
- 150 E South St
- 1185 Beechtree Ln
- 1682 Millpond Ln
- 1636 Millpond Ln
- 1679 Millpond Ln
- 1663 Millpond Ln
- 1640 Millpond Ln
- 1650 Millpond Ln
- 1660 Millpond Ln
- 1653 Millpond Ln
- 1686 Millpond Ln
- 1630 Millpond Ln
- 1658 Millpond Ln
Your Personal Tour Guide
Ask me questions while you tour the home.