75 & 76 Turtle Back Ln W New Canaan, CT 06840
Estimated Value: $4,749,000 - $6,532,993
8
Beds
11
Baths
11,043
Sq Ft
$500/Sq Ft
Est. Value
About This Home
This home is located at 75 & 76 Turtle Back Ln W, New Canaan, CT 06840 and is currently estimated at $5,518,331, approximately $499 per square foot. 75 & 76 Turtle Back Ln W is a home located in Fairfield County with nearby schools including West Elementary School, Saxe Middle School, and New Canaan High School.
Ownership History
Date
Name
Owned For
Owner Type
Purchase Details
Closed on
Feb 18, 2020
Sold by
Tseng Steven and Tseng Christopher
Bought by
Turtleback Holdings Llc
Current Estimated Value
Purchase Details
Closed on
Jan 9, 2020
Sold by
Hanson Joseph
Bought by
Tseng Christopher and Tseng Steven
Create a Home Valuation Report for This Property
The Home Valuation Report is an in-depth analysis detailing your home's value as well as a comparison with similar homes in the area
Home Values in the Area
Average Home Value in this Area
Purchase History
| Date | Buyer | Sale Price | Title Company |
|---|---|---|---|
| Turtleback Holdings Llc | -- | None Available | |
| Tseng Christopher | $2,400,000 | None Available |
Source: Public Records
Tax History Compared to Growth
Tax History
| Year | Tax Paid | Tax Assessment Tax Assessment Total Assessment is a certain percentage of the fair market value that is determined by local assessors to be the total taxable value of land and additions on the property. | Land | Improvement |
|---|---|---|---|---|
| 2025 | $55,486 | $3,324,510 | $1,164,800 | $2,159,710 |
| 2024 | $53,658 | $3,324,510 | $1,164,800 | $2,159,710 |
| 2023 | $57,009 | $3,010,000 | $821,380 | $2,188,620 |
| 2022 | $55,294 | $3,010,000 | $821,380 | $2,188,620 |
| 2021 | $54,662 | $3,010,000 | $821,380 | $2,188,620 |
| 2020 | $54,662 | $3,010,000 | $821,380 | $2,188,620 |
| 2019 | $75,170 | $4,121,180 | $1,376,970 | $2,744,210 |
| 2018 | $96,681 | $5,700,520 | $1,105,090 | $4,595,430 |
| 2017 | $95,028 | $5,700,520 | $1,105,090 | $4,595,430 |
| 2016 | $92,975 | $5,700,520 | $1,105,090 | $4,595,430 |
| 2015 | $94,401 | $5,700,520 | $1,105,090 | $4,595,430 |
| 2014 | $88,586 | $5,700,520 | $1,105,090 | $4,595,430 |
Source: Public Records
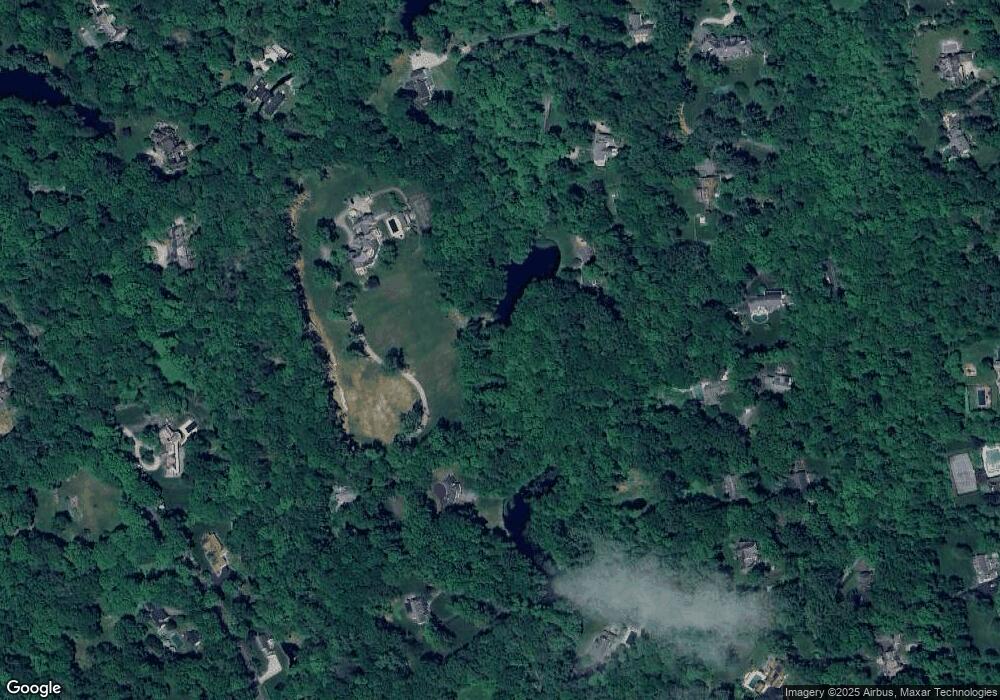
Map
Nearby Homes
- 928 West Rd
- 176 Logan Rd
- 171 Proprietors Crossing
- 1247 Oenoke Ridge
- 1421 Oenoke Ridge
- 119 Proprietors Crossing
- 230 & 244 West Rd
- 104 Dans Hwy
- 26 Pequot Ln
- 62 Summersweet Ln
- 331 Dans Hwy
- 104 Ramhorne Rd
- 22 Father Peters Ln
- 148 W Hills Rd
- 51 Reeder Ln
- 0 Rolling Meadow Ln Unit ONEH6302491
- 1580 Ponus Ridge
- 565 Oenoke Ridge
- 650 Laurel Rd
- 501 Woodbine Rd
- 76 Turtle Back Ln W
- 935 West Rd
- 74 Turtle Back Ln W
- 67 Turtle Back Ln W
- 108 Logan Rd
- 75 and 76 Turtle Back Ln W
- 104 Logan Rd
- 909 West Rd
- 945 West Rd
- 93 Louises Ln
- 871 West Rd
- 48 Turtle Back Ln W
- 110 Logan Rd
- 78 Logan Rd
- 75 Turtle Back Ln W
- 80 Turtle Back Ln E
- 955 West Rd
- 75 Louises Ln
- 845 West Rd
- 86 Logan Rd