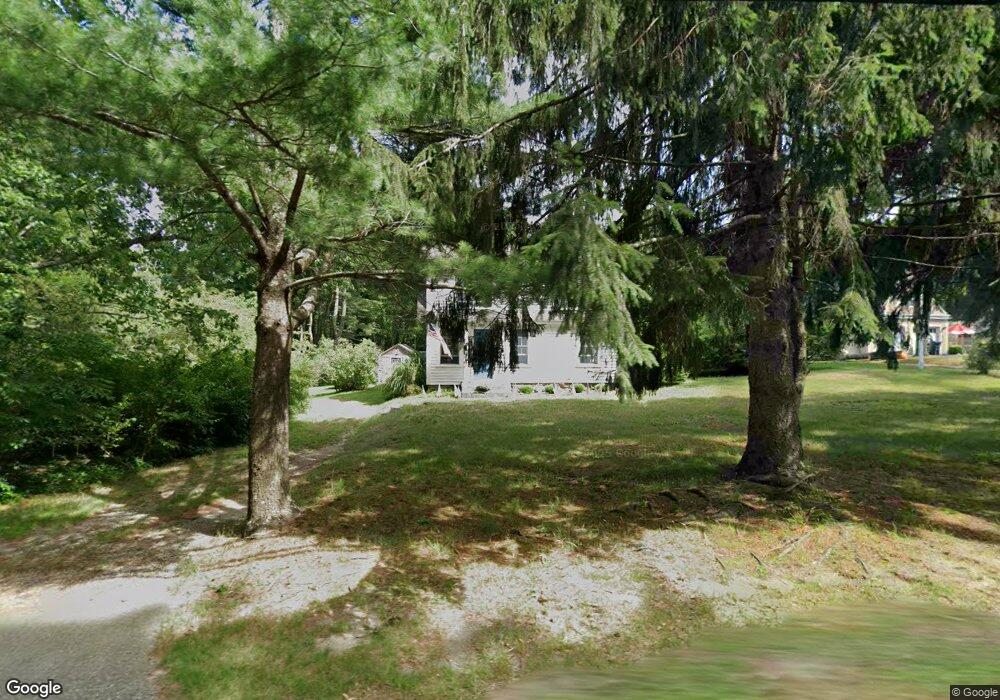
75 Acorn St Unit 1 Marshfield, MA 02050
Estimated Value: $708,000 - $813,000
4
Beds
1
Bath
1,736
Sq Ft
$439/Sq Ft
Est. Value
About This Home
This home is located at 75 Acorn St Unit 1, Marshfield, MA 02050 and is currently estimated at $762,391, approximately $439 per square foot. 75 Acorn St Unit 1 is a home located in Plymouth County with nearby schools including South River, Furnace Brook Middle School, and Marshfield High School.
Ownership History
Date
Name
Owned For
Owner Type
Purchase Details
Closed on
Dec 7, 2017
Sold by
Houde Colleen A
Bought by
Houde Colleen A and Farrell Michael S
Current Estimated Value
Purchase Details
Closed on
Jun 13, 2017
Sold by
Obrien-Snow Lauren
Bought by
Houde Colleen A
Home Financials for this Owner
Home Financials are based on the most recent Mortgage that was taken out on this home.
Original Mortgage
$307,500
Interest Rate
4.03%
Mortgage Type
New Conventional
Purchase Details
Closed on
Feb 28, 2005
Sold by
Vanrenen Louis J
Bought by
Obrien-Snow Lauren and Sullivan Brian
Create a Home Valuation Report for This Property
The Home Valuation Report is an in-depth analysis detailing your home's value as well as a comparison with similar homes in the area
Home Values in the Area
Average Home Value in this Area
Purchase History
| Date | Buyer | Sale Price | Title Company |
|---|---|---|---|
| Houde Colleen A | -- | -- | |
| Houde Colleen A | $447,500 | -- | |
| Obrien-Snow Lauren | $330,000 | -- |
Source: Public Records
Mortgage History
| Date | Status | Borrower | Loan Amount |
|---|---|---|---|
| Previous Owner | Houde Colleen A | $307,500 | |
| Previous Owner | Obrien-Snow Lauren | $374,000 | |
| Previous Owner | Obrien-Snow Lauren | $352,500 |
Source: Public Records
Tax History Compared to Growth
Tax History
| Year | Tax Paid | Tax Assessment Tax Assessment Total Assessment is a certain percentage of the fair market value that is determined by local assessors to be the total taxable value of land and additions on the property. | Land | Improvement |
|---|---|---|---|---|
| 2025 | $7,070 | $714,100 | $326,500 | $387,600 |
| 2024 | $6,684 | $643,300 | $311,200 | $332,100 |
| 2023 | $6,557 | $583,300 | $278,000 | $305,300 |
| 2022 | $6,557 | $506,300 | $218,600 | $287,700 |
| 2021 | $5,979 | $453,300 | $218,600 | $234,700 |
| 2020 | $5,603 | $420,300 | $190,300 | $230,000 |
| 2019 | $5,624 | $420,300 | $190,300 | $230,000 |
| 2018 | $5,619 | $420,300 | $190,300 | $230,000 |
| 2017 | $4,415 | $321,800 | $190,300 | $131,500 |
| 2016 | $4,293 | $309,300 | $183,800 | $125,500 |
| 2015 | $4,111 | $309,300 | $183,800 | $125,500 |
| 2014 | $3,792 | $285,300 | $168,600 | $116,700 |
Source: Public Records
Map
Nearby Homes
- 5 Maple Ln Unit 5
- 431 Moraine St
- 15 Lady Slipper Ln
- 713 Webster St
- 20 Amado Way
- 184 King Phillips Pathe
- 311 S River St
- 92 Salt Meadow Waye
- 3 Harlow Brook Way Unit 3
- 2 Harlow Brook Way Unit 2
- 2 Secret Pond Way Unit 35
- 1 Secret Pond Way Unit 36
- The Duplex Plan at The Village at Harlow Brook
- The Chatham Plan at The Village at Harlow Brook
- The Falmouth Plan at The Village at Harlow Brook
- 235 Main St
- 167 Planting Field Rd
- 14 Red Pony Path
- 30 Chandler Dr
- 341 Furnace St