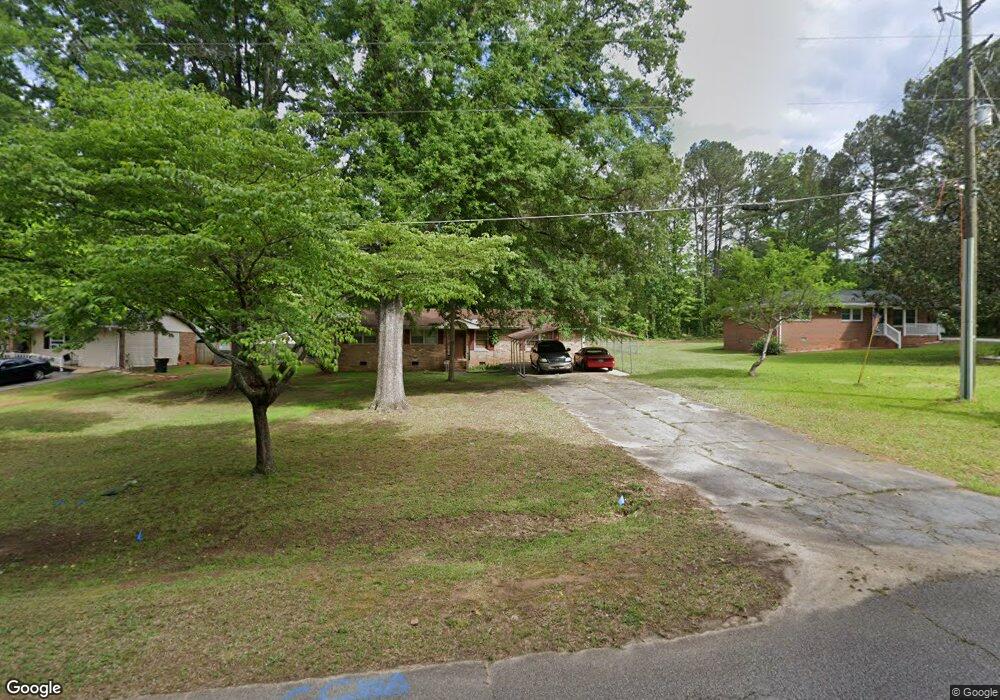
75 Angelo Rd Newnan, GA 30263
Estimated Value: $239,499 - $270,000
3
Beds
1
Bath
1,475
Sq Ft
$171/Sq Ft
Est. Value
About This Home
This home is located at 75 Angelo Rd, Newnan, GA 30263 and is currently estimated at $251,875, approximately $170 per square foot. 75 Angelo Rd is a home located in Coweta County with nearby schools including Arnco-Sargent Elementary School, Evans Middle School, and Newnan High School.
Ownership History
Date
Name
Owned For
Owner Type
Purchase Details
Closed on
Apr 23, 2019
Sold by
Williams Pamela
Bought by
Lee Pamela
Current Estimated Value
Purchase Details
Closed on
Feb 28, 2014
Sold by
Henson Bart W
Bought by
Smcc Rentals Llc
Purchase Details
Closed on
Nov 3, 1994
Sold by
Dance John Jill
Bought by
Henson Bart
Home Financials for this Owner
Home Financials are based on the most recent Mortgage that was taken out on this home.
Original Mortgage
$60,550
Interest Rate
8.68%
Mortgage Type
FHA
Purchase Details
Closed on
Feb 25, 1989
Bought by
Dance John F and Dance Jill
Create a Home Valuation Report for This Property
The Home Valuation Report is an in-depth analysis detailing your home's value as well as a comparison with similar homes in the area
Home Values in the Area
Average Home Value in this Area
Purchase History
| Date | Buyer | Sale Price | Title Company |
|---|---|---|---|
| Lee Pamela | -- | -- | |
| Williams Pamela | $109,000 | -- | |
| Smcc Rentals Llc | $60,000 | -- | |
| Henson Bart | $60,000 | -- | |
| Dance John F | $54,000 | -- |
Source: Public Records
Mortgage History
| Date | Status | Borrower | Loan Amount |
|---|---|---|---|
| Previous Owner | Henson Bart | $60,550 |
Source: Public Records
Tax History Compared to Growth
Tax History
| Year | Tax Paid | Tax Assessment Tax Assessment Total Assessment is a certain percentage of the fair market value that is determined by local assessors to be the total taxable value of land and additions on the property. | Land | Improvement |
|---|---|---|---|---|
| 2025 | $1,746 | $73,909 | $16,000 | $57,909 |
| 2024 | $1,646 | $70,901 | $16,000 | $54,901 |
| 2023 | $1,646 | $60,089 | $16,000 | $44,089 |
| 2022 | $1,456 | $59,111 | $16,000 | $43,111 |
| 2021 | $1,118 | $42,451 | $10,000 | $32,451 |
| 2020 | $980 | $43,504 | $10,000 | $33,504 |
| 2019 | $940 | $32,101 | $6,000 | $26,101 |
| 2018 | $877 | $29,918 | $6,000 | $23,918 |
| 2017 | $773 | $26,383 | $6,000 | $20,383 |
| 2016 | $764 | $26,383 | $6,000 | $20,383 |
| 2015 | $683 | $26,383 | $6,000 | $20,383 |
| 2014 | $780 | $27,604 | $6,000 | $21,604 |
Source: Public Records
Map
Nearby Homes
- 12 Ulas B Ware Rd
- 1242 Witcher Rd
- 0 & 1206 Macedonia Rd
- 0 Macedonia Rd Unit 10587744
- 60 New St
- 279 Doc Perry Rd
- 21 Old Carrollton Rd
- 1206 Macedonia Rd
- 1206 + 0 Macedonia Rd
- 13 Tea House Ln Unit 13
- 21 Tea House Ln Unit 21
- 16 Tea House Ln Unit 16
- 0 Witcher Rd Unit 14.23+/- AC 10524234
- 96 Ballyfin Way
- LOT 29 Mossy Oak Ct Unit 29
- 66 Belle Hall Dr Unit 2
- 68 Ballyfin Way
- 11 Hubbard Rd
- 1 Arnco Second St
- 62 Dawn St
- 83 Angelo Rd
- 63 Angelo Rd
- 32 Carol Manor Dr
- 91 Angelo Rd
- 78 Angelo Rd
- 70 Angelo Rd
- 48 Carol Manor Dr
- 60 Angelo Rd
- 86 Angelo Rd
- 105 Angelo Rd
- 54 Carol Manor Dr
- 478 Macedonia Rd
- 468 Macedonia Rd
- 33 Angelo Rd
- 106 Angelo Rd
- 492 Macedonia Rd
- 458 Macedonia Rd
- 514 Macedonia Rd
- 61 Carol Manor Dr
- 106 Newton Rd