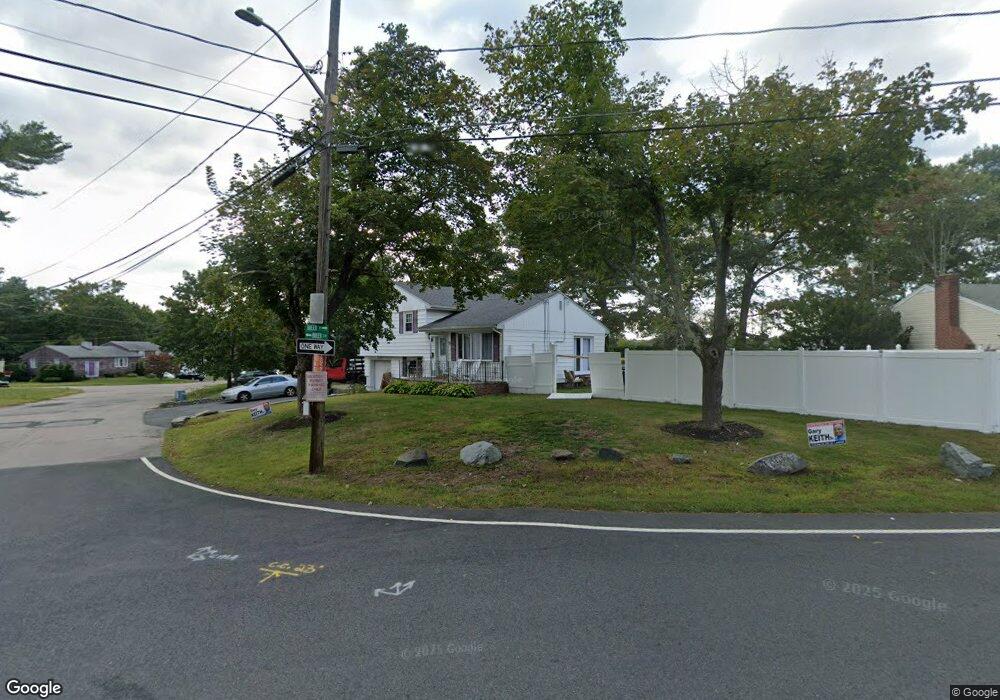
75 Breer St Brockton, MA 02301
Clifton Heights NeighborhoodEstimated Value: $490,000 - $526,000
3
Beds
2
Baths
1,540
Sq Ft
$331/Sq Ft
Est. Value
About This Home
This home is located at 75 Breer St, Brockton, MA 02301 and is currently estimated at $509,597, approximately $330 per square foot. 75 Breer St is a home located in Plymouth County with nearby schools including Gilmore Elementary School, John F. Kennedy Elementary School, and Davis K-8 School.
Ownership History
Date
Name
Owned For
Owner Type
Purchase Details
Closed on
Apr 15, 2024
Sold by
Goncalves Eugenie
Bought by
Genie Goncalves Lt and Goncalves
Current Estimated Value
Purchase Details
Closed on
Sep 25, 2015
Sold by
Goncalves Antonio D and Goncalves Eugenie
Bought by
Goncalves Eugenie
Create a Home Valuation Report for This Property
The Home Valuation Report is an in-depth analysis detailing your home's value as well as a comparison with similar homes in the area
Home Values in the Area
Average Home Value in this Area
Purchase History
| Date | Buyer | Sale Price | Title Company |
|---|---|---|---|
| Genie Goncalves Lt | -- | None Available | |
| Genie Goncalves Lt | -- | None Available | |
| Goncalves Eugenie | -- | -- | |
| Goncalves Eugenie | -- | -- |
Source: Public Records
Mortgage History
| Date | Status | Borrower | Loan Amount |
|---|---|---|---|
| Previous Owner | Goncalves Eugenie | $209,000 | |
| Previous Owner | Goncalves Eugenie | $205,000 |
Source: Public Records
Tax History
| Year | Tax Paid | Tax Assessment Tax Assessment Total Assessment is a certain percentage of the fair market value that is determined by local assessors to be the total taxable value of land and additions on the property. | Land | Improvement |
|---|---|---|---|---|
| 2025 | $5,440 | $449,200 | $146,400 | $302,800 |
| 2024 | $5,238 | $435,800 | $146,400 | $289,400 |
| 2023 | $4,773 | $367,700 | $111,500 | $256,200 |
| 2022 | $4,423 | $316,600 | $101,400 | $215,200 |
| 2021 | $4,437 | $306,000 | $95,900 | $210,100 |
| 2020 | $4,640 | $306,300 | $91,900 | $214,400 |
| 2019 | $5,041 | $324,400 | $86,200 | $238,200 |
| 2018 | $0 | $277,000 | $86,200 | $190,800 |
| 2017 | $3,845 | $238,800 | $86,200 | $152,600 |
| 2016 | $3,812 | $219,600 | $82,300 | $137,300 |
| 2015 | $3,496 | $192,600 | $82,300 | $110,300 |
| 2014 | $3,423 | $188,800 | $82,300 | $106,500 |
Source: Public Records
Map
Nearby Homes
Your Personal Tour Guide
Ask me questions while you tour the home.