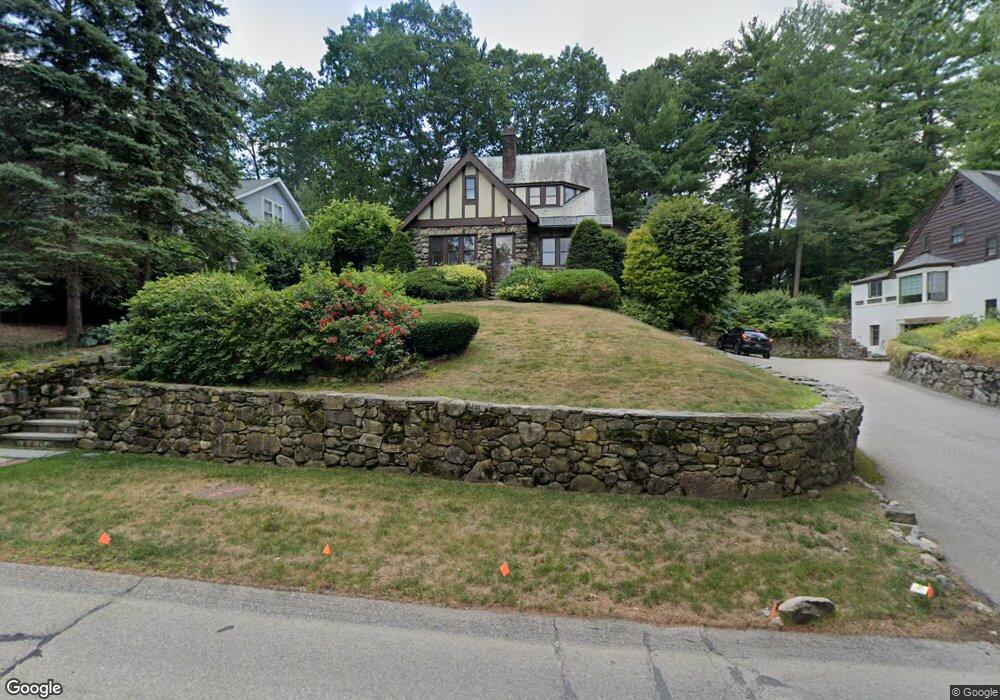
75 Brook St Unit 75 Wellesley, MA 02482
Dana Hall NeighborhoodEstimated Value: $1,534,000 - $1,774,000
3
Beds
2
Baths
2,155
Sq Ft
$761/Sq Ft
Est. Value
About This Home
This home is located at 75 Brook St Unit 75, Wellesley, MA 02482 and is currently estimated at $1,640,690, approximately $761 per square foot. 75 Brook St Unit 75 is a home located in Norfolk County with nearby schools including Hunnewell Elementary School, Wellesley Middle School, and Wellesley Sr High School.
Ownership History
Date
Name
Owned For
Owner Type
Purchase Details
Closed on
May 19, 2016
Sold by
Guiffre Dorothy A
Bought by
Harper George F and Harper Jamie
Current Estimated Value
Purchase Details
Closed on
Oct 2, 2015
Sold by
Guiffre Dorothy A
Bought by
Harper George F and Harper Jamie
Home Financials for this Owner
Home Financials are based on the most recent Mortgage that was taken out on this home.
Original Mortgage
$290,400
Interest Rate
3.95%
Mortgage Type
New Conventional
Create a Home Valuation Report for This Property
The Home Valuation Report is an in-depth analysis detailing your home's value as well as a comparison with similar homes in the area
Home Values in the Area
Average Home Value in this Area
Purchase History
| Date | Buyer | Sale Price | Title Company |
|---|---|---|---|
| Harper George F | $915,000 | -- | |
| Harper George F | $915,000 | -- |
Source: Public Records
Mortgage History
| Date | Status | Borrower | Loan Amount |
|---|---|---|---|
| Previous Owner | Harper George F | $290,400 |
Source: Public Records
Tax History Compared to Growth
Tax History
| Year | Tax Paid | Tax Assessment Tax Assessment Total Assessment is a certain percentage of the fair market value that is determined by local assessors to be the total taxable value of land and additions on the property. | Land | Improvement |
|---|---|---|---|---|
| 2025 | $12,675 | $1,233,000 | $994,000 | $239,000 |
| 2024 | $12,305 | $1,182,000 | $949,000 | $233,000 |
| 2023 | $12,503 | $1,092,000 | $868,000 | $224,000 |
| 2022 | $11,189 | $958,000 | $718,000 | $240,000 |
| 2021 | $11,257 | $958,000 | $718,000 | $240,000 |
| 2020 | $11,074 | $958,000 | $718,000 | $240,000 |
| 2019 | $11,084 | $958,000 | $718,000 | $240,000 |
| 2018 | $10,719 | $897,000 | $710,000 | $187,000 |
| 2017 | $10,576 | $897,000 | $710,000 | $187,000 |
| 2016 | $10,245 | $866,000 | $698,000 | $168,000 |
| 2015 | $10,011 | $866,000 | $698,000 | $168,000 |
Source: Public Records
Map
Nearby Homes
- 9 Hampden St
- 17 Atwood St
- 94 Rice St
- 14 Twitchell St
- 93 Seaver St
- 32 Twitchell St
- 29 Cottage St
- 98 Great Plain Ave
- 609 Washington St Unit 303
- 5 Abbott St
- 100 Linden St Unit 111
- 100 Linden St Unit 103
- 63 Linden St Unit 1
- 68 Linden St Unit 68
- 32 Kingsbury St Unit A
- 16 Oak St
- 11 Oak St Unit 62
- 32 Donizetti St
- 42 Calvin Rd
- 148 Weston Rd Unit 208