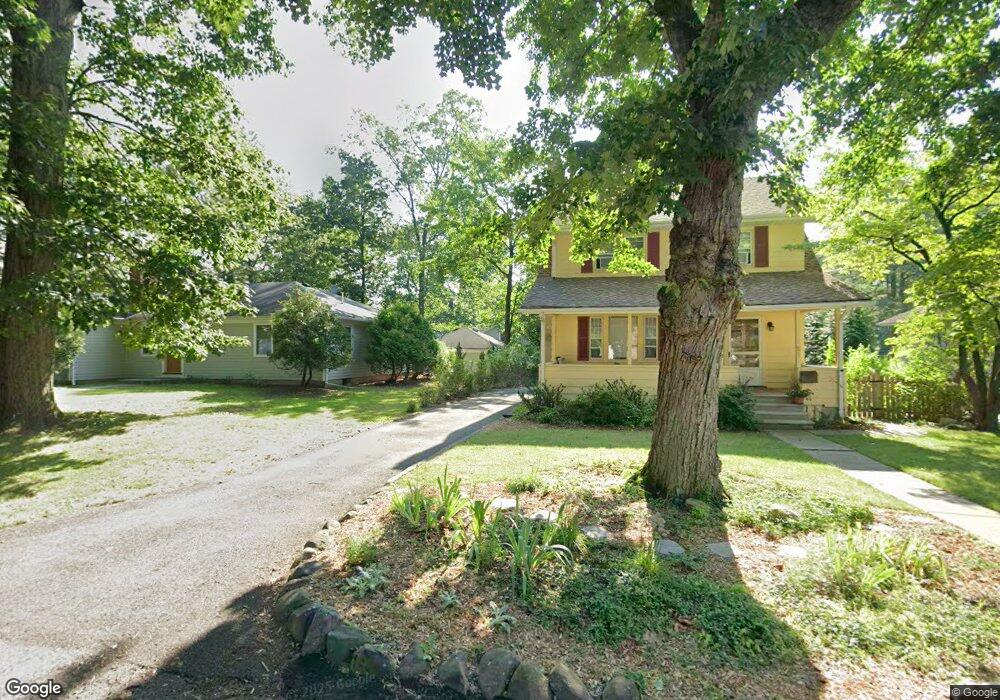
75 Brookside Ave Allendale, NJ 07401
Estimated Value: $1,104,000 - $1,329,000
3
Beds
3
Baths
2,204
Sq Ft
$563/Sq Ft
Est. Value
About This Home
This home is located at 75 Brookside Ave, Allendale, NJ 07401 and is currently estimated at $1,240,221, approximately $562 per square foot. 75 Brookside Ave is a home located in Bergen County with nearby schools including Hillside Elementary School, Brookside Elementary School, and Northern Highlands Reg High School.
Ownership History
Date
Name
Owned For
Owner Type
Purchase Details
Closed on
Feb 23, 2021
Sold by
Struyk Todd and Struyk Marianne
Bought by
Brady Sinead Fallon and Fayle Jason Colin
Current Estimated Value
Home Financials for this Owner
Home Financials are based on the most recent Mortgage that was taken out on this home.
Original Mortgage
$666,400
Interest Rate
3.1%
Mortgage Type
New Conventional
Purchase Details
Closed on
Oct 18, 2000
Sold by
Lier Gertruida
Bought by
Struyk Todd and Struyk Marianne
Home Financials for this Owner
Home Financials are based on the most recent Mortgage that was taken out on this home.
Original Mortgage
$136,000
Interest Rate
7.81%
Create a Home Valuation Report for This Property
The Home Valuation Report is an in-depth analysis detailing your home's value as well as a comparison with similar homes in the area
Home Values in the Area
Average Home Value in this Area
Purchase History
| Date | Buyer | Sale Price | Title Company |
|---|---|---|---|
| Brady Sinead Fallon | $833,000 | Westcor Land Title Ins Co | |
| Brady Sinead Fallon | $833,000 | None Listed On Document | |
| Struyk Todd | $325,000 | -- |
Source: Public Records
Mortgage History
| Date | Status | Borrower | Loan Amount |
|---|---|---|---|
| Previous Owner | Brady Sinead Fallon | $666,400 | |
| Previous Owner | Struyk Todd | $136,000 |
Source: Public Records
Tax History
| Year | Tax Paid | Tax Assessment Tax Assessment Total Assessment is a certain percentage of the fair market value that is determined by local assessors to be the total taxable value of land and additions on the property. | Land | Improvement |
|---|---|---|---|---|
| 2025 | $19,327 | $964,900 | $454,500 | $510,400 |
| 2024 | $18,219 | $916,400 | $434,300 | $482,100 |
| 2023 | $18,407 | $828,500 | $357,800 | $470,700 |
| 2022 | $18,407 | $808,400 | $333,000 | $475,400 |
| 2021 | $18,589 | $792,000 | $321,800 | $470,200 |
| 2020 | $14,823 | $614,300 | $312,800 | $301,500 |
| 2019 | $14,430 | $614,300 | $312,800 | $301,500 |
| 2018 | $14,110 | $614,300 | $312,800 | $301,500 |
| 2017 | $14,055 | $614,300 | $312,800 | $301,500 |
| 2016 | $14,074 | $614,300 | $312,800 | $301,500 |
| 2015 | $13,791 | $614,300 | $312,800 | $301,500 |
| 2014 | $12,687 | $472,600 | $303,800 | $168,800 |
Source: Public Records
Map
Nearby Homes
- 260 W Allendale Ave
- 373 W Crescent Ave
- 77 Myrtle Ave
- 8 Crestwood Mews
- 1002 Whitney Ln
- 6 Cottage Place
- 33 Homewood Ave
- 53 Lockwood Dr
- 8 Masterson Ct
- 19 Fox Run Rd Unit 19
- 24 Summit Ave
- 37-1 Tamaron Dr
- 5 Burning Hollow Rd
- 314 Meadowbrook Rd
- 103 Crescent Ave
- 31 Smith St
- 6 Burning Hollow Rd
- 10 E Allendale Rd
- 16-3 Tamaron Dr
- 39 1 & 2 Smith
Your Personal Tour Guide
Ask me questions while you tour the home.