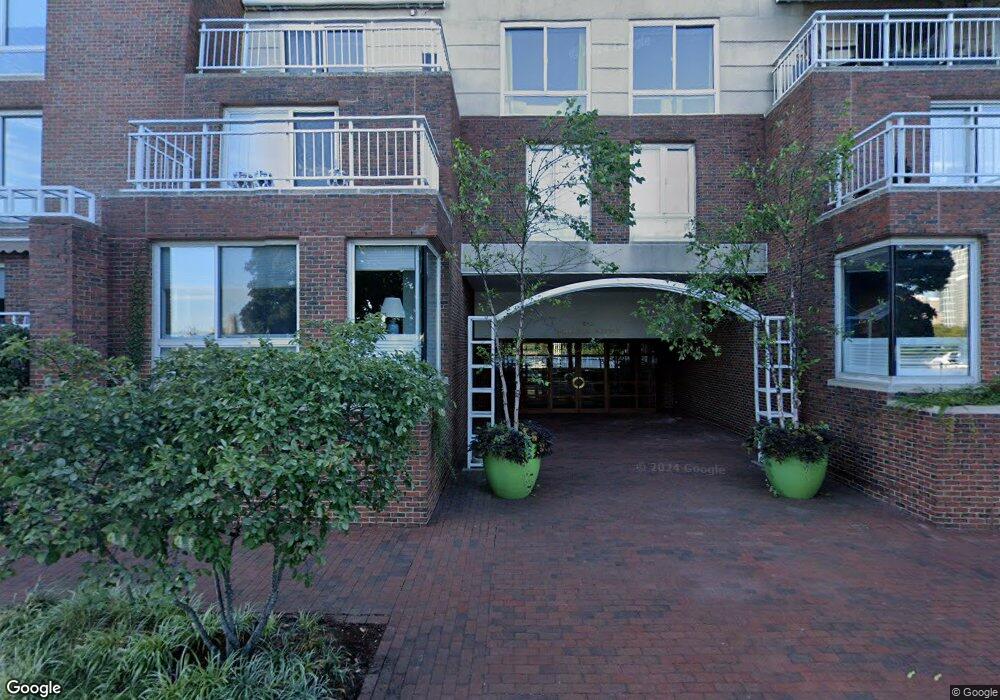
75 Cambridge Pkwy Unit 83 Cambridge, MA 02142
East Cambridge NeighborhoodEstimated Value: $2,377,819 - $2,774,000
2
Beds
2
Baths
1,705
Sq Ft
$1,475/Sq Ft
Est. Value
About This Home
This home is located at 75 Cambridge Pkwy Unit 83, Cambridge, MA 02142 and is currently estimated at $2,514,205, approximately $1,474 per square foot. 75 Cambridge Pkwy Unit 83 is a home located in Middlesex County with nearby schools including Community Charter School of Cambridge, Torit Montessori School, and Advent School.
Ownership History
Date
Name
Owned For
Owner Type
Purchase Details
Closed on
Oct 7, 1999
Sold by
May Ltd T
Bought by
Park Byung Wong
Current Estimated Value
Home Financials for this Owner
Home Financials are based on the most recent Mortgage that was taken out on this home.
Original Mortgage
$640,000
Outstanding Balance
$206,156
Interest Rate
7.81%
Mortgage Type
Purchase Money Mortgage
Estimated Equity
$2,324,376
Purchase Details
Closed on
Jun 29, 1995
Sold by
Josephy Miller E and Josephy Jennifer
Bought by
May Limited T
Purchase Details
Closed on
Mar 25, 1991
Sold by
O'Donohue Brian F and O'Donohue Kathleen
Bought by
Miller E Matthew and Josephy Jennifer
Home Financials for this Owner
Home Financials are based on the most recent Mortgage that was taken out on this home.
Original Mortgage
$296,000
Interest Rate
9.27%
Mortgage Type
Purchase Money Mortgage
Purchase Details
Closed on
Nov 1, 1989
Sold by
75-83 Camb Pky Lp
Bought by
Odonohue Brian F
Create a Home Valuation Report for This Property
The Home Valuation Report is an in-depth analysis detailing your home's value as well as a comparison with similar homes in the area
Home Values in the Area
Average Home Value in this Area
Purchase History
| Date | Buyer | Sale Price | Title Company |
|---|---|---|---|
| Park Byung Wong | $800,000 | -- | |
| May Limited T | $590,000 | -- | |
| Miller E Matthew | $371,000 | -- | |
| Odonohue Brian F | $510,500 | -- |
Source: Public Records
Mortgage History
| Date | Status | Borrower | Loan Amount |
|---|---|---|---|
| Open | Odonohue Brian F | $640,000 | |
| Previous Owner | Odonohue Brian F | $300,000 | |
| Previous Owner | Odonohue Brian F | $299,970 | |
| Previous Owner | Odonohue Brian F | $296,000 |
Source: Public Records
Tax History Compared to Growth
Tax History
| Year | Tax Paid | Tax Assessment Tax Assessment Total Assessment is a certain percentage of the fair market value that is determined by local assessors to be the total taxable value of land and additions on the property. | Land | Improvement |
|---|---|---|---|---|
| 2025 | $13,906 | $2,189,900 | $0 | $2,189,900 |
| 2024 | $12,517 | $2,114,400 | $0 | $2,114,400 |
| 2023 | $12,210 | $2,083,600 | $0 | $2,083,600 |
| 2022 | $12,147 | $2,051,900 | $0 | $2,051,900 |
| 2021 | $12,147 | $2,076,400 | $0 | $2,076,400 |
| 2020 | $11,414 | $1,985,100 | $0 | $1,985,100 |
| 2019 | $10,959 | $1,845,000 | $0 | $1,845,000 |
| 2018 | $10,774 | $1,712,900 | $0 | $1,712,900 |
| 2017 | $10,446 | $1,609,500 | $0 | $1,609,500 |
| 2016 | $10,254 | $1,466,900 | $0 | $1,466,900 |
| 2015 | $10,168 | $1,300,200 | $0 | $1,300,200 |
| 2014 | $9,886 | $1,179,700 | $0 | $1,179,700 |
Source: Public Records
Map
Nearby Homes
- 75-83 Cambridge Pkwy Unit E 802
- 75-83 Cambridge Pkwy Unit W702
- 75-83 Cambridge Pkwy Unit E902
- 75-83 Cambridge Pkwy Unit 303
- 75-83
- 10 Rogers St Unit 707
- 10 Rogers St Unit 308
- 10 Rogers St Unit 415
- 10 Rogers St Unit 213
- 10 Rogers St Unit 703
- 10 Rogers St Unit PH19
- 95 2nd St Unit 3
- 212 Third St
- 133 Charles St Unit 133
- 131 Charles St
- 6 Canal Park Unit 602
- 4 Canal Park Unit 609
- 20 David g Mugar Way
- 1 W Hill Place
- 6 W Hill Place
- 75 Cambridge Pkwy Unit E904
- 75 Cambridge Pkwy Unit E1201
- 75 Cambridge Pkwy Unit 83
- 75 Cambridge Pkwy Unit 83
- 75 Cambridge Pkwy Unit 83
- 75 Cambridge Pkwy Unit 83
- 75 Cambridge Pkwy Unit 83
- 75 Cambridge Pkwy Unit 83
- 75 Cambridge Pkwy Unit 83
- 75 Cambridge Pkwy Unit 83
- 75 Cambridge Pkwy Unit 83
- 75 Cambridge Pkwy Unit 83
- 75 Cambridge Pkwy Unit 83
- 75 Cambridge Pkwy Unit 83
- 75 Cambridge Pkwy Unit 83
- 75 Cambridge Pkwy Unit 83
- 75 Cambridge Pkwy Unit 83
- 75 Cambridge Pkwy Unit 83
- 75 Cambridge Pkwy Unit 83
- 75 Cambridge Pkwy Unit 83