
Landlord's Agent in 2025
Pat Bagni-Latimer
MA Real Estate Center
(978) 815-6965
5 in this area
75 Total Sales


Estimated Value: $446,117 - $563,000
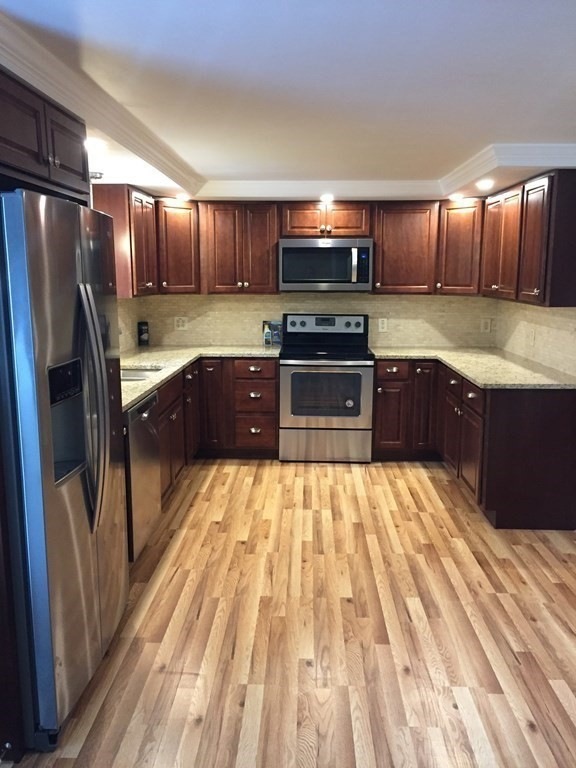
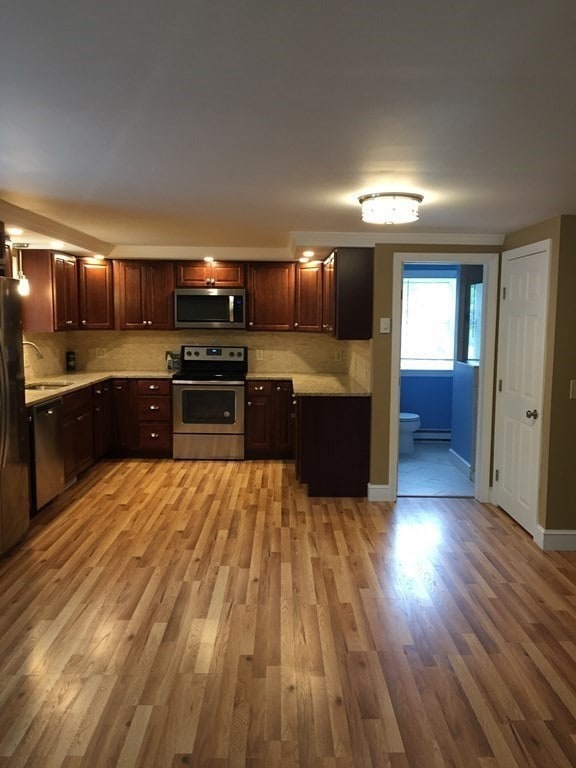
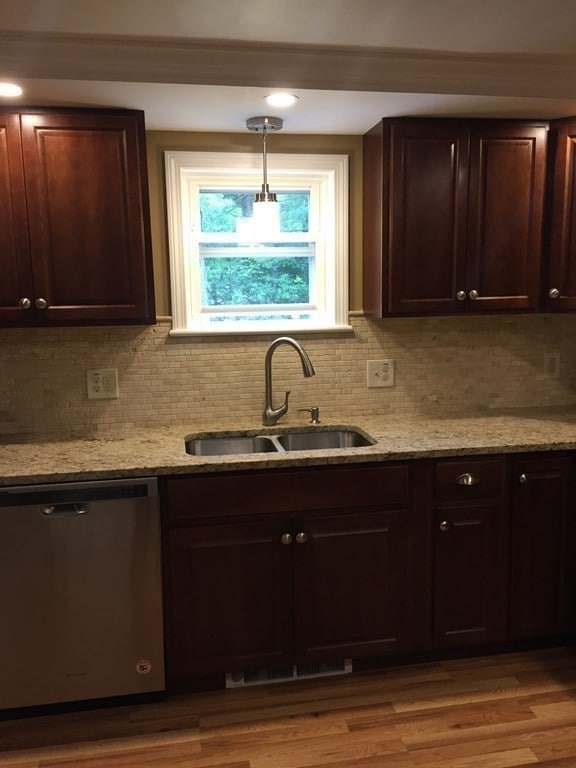
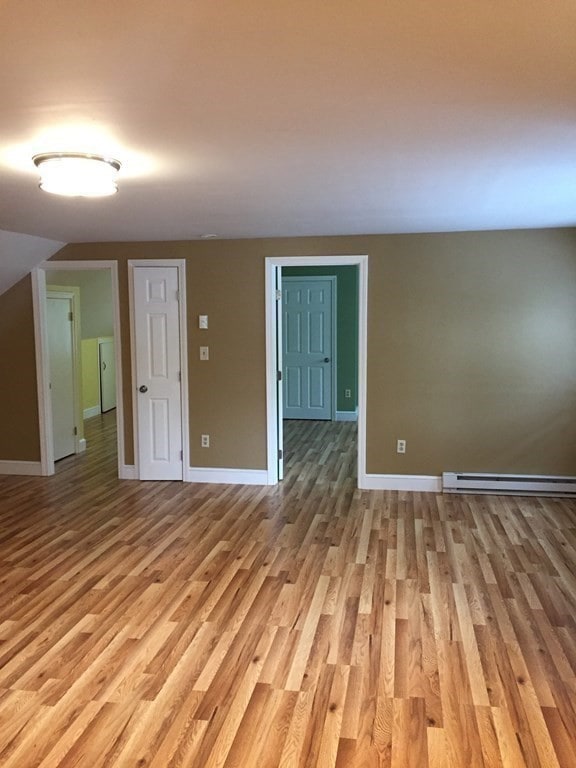
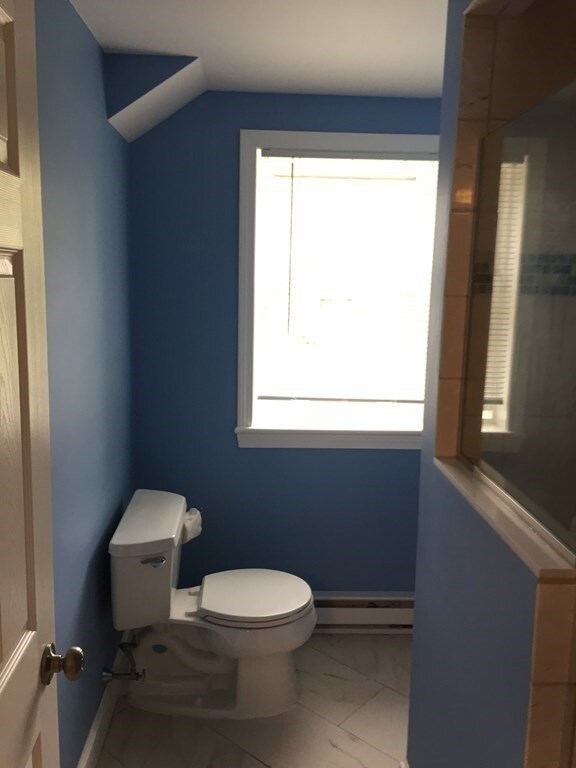
One bedroom unit with all newer appliances. In unit stack-able washer/dryer for tenant use. Full bath, all tile with walk in shower stall. The exterior features a deck large enough for seasonal enjoyment. A very short distance to the Shirley Village Train Stop (Boston - Fitchburg line) as well as all that the Village has to offer with the stores and eateries. The property has off street assigned parking. This unit must be seen to be believed. Is this your new apartment home, schedule your tour today. No Pets.
| Date | Buyer | Sale Price | Title Company |
|---|---|---|---|
| Hebert June A | -- | -- | |
| Gendron Agnes D | -- | -- | |
| Gendron Ft | -- | -- |
| Date | Event | Price | List to Sale | Price per Sq Ft |
|---|---|---|---|---|
| 07/12/2025 07/12/25 | Rented | $1,500 | 0.0% | -- |
| 07/07/2025 07/07/25 | Under Contract | -- | -- | -- |
| 06/26/2025 06/26/25 | For Rent | $1,500 | 0.0% | -- |
| 06/04/2021 06/04/21 | Rented | $1,500 | 0.0% | -- |
| 05/21/2021 05/21/21 | Under Contract | -- | -- | -- |
| 03/30/2021 03/30/21 | For Rent | $1,500 | 0.0% | -- |
| 08/23/2020 08/23/20 | Rented | $1,500 | 0.0% | -- |
| 08/13/2020 08/13/20 | For Rent | $1,500 | 0.0% | -- |
| 06/12/2019 06/12/19 | Rented | $1,500 | 0.0% | -- |
| 06/11/2019 06/11/19 | Under Contract | -- | -- | -- |
| 05/29/2019 05/29/19 | For Rent | $1,500 | -- | -- |
| Year | Tax Paid | Tax Assessment Tax Assessment Total Assessment is a certain percentage of the fair market value that is determined by local assessors to be the total taxable value of land and additions on the property. | Land | Improvement |
|---|---|---|---|---|
| 2025 | $48 | $373,200 | $130,600 | $242,600 |
| 2024 | $4,698 | $346,200 | $111,400 | $234,800 |
| 2023 | $4,309 | $303,900 | $111,400 | $192,500 |
| 2022 | $4,413 | $285,100 | $107,600 | $177,500 |
| 2021 | $4,366 | $264,100 | $96,100 | $168,000 |
| 2020 | $4,156 | $258,000 | $96,100 | $161,900 |
| 2019 | $4,075 | $253,400 | $96,100 | $157,300 |
| 2018 | $4,015 | $244,500 | $92,200 | $152,300 |
| 2017 | $3,912 | $236,800 | $84,500 | $152,300 |
| 2016 | $3,480 | $210,800 | $86,100 | $124,700 |
| 2015 | $3,396 | $196,200 | $80,700 | $115,500 |
Landlord's Agent in 2025
Pat Bagni-Latimer
MA Real Estate Center
(978) 815-6965
5 in this area
75 Total Sales
Landlord's Co-Listing Agent in 2025
Ron Morrison
MA Real Estate Center
(978) 815-6965
3 in this area
57 Total Sales
M
Seller's Agent in 2021
Matthew DiGenova-Curtin
MA Real Estate Center
Source: MLS Property Information Network (MLS PIN)
MLS Number: 73396955
APN: SHIR-000023-D000000-000009
Disclaimer: Certain information contained herein is derived from information provided by parties other than Homes.com. All information provided is deemed reliable, but is not guaranteed to be accurate and should be independently verified.
![]() The property listing data and information, or the Images, set forth herein were provided to MLS Property Information Network, Inc. from third party sources, including sellers, lessors and public records, and were compiled by MLS Property Information Network, Inc. The property listing data and information, and the Images, are for the personal, non-commercial use of consumers having a good faith interest in purchasing or leasing listed properties of the type displayed to them and may not be used for any purpose other than to identify prospective properties which such consumers may have a good faith interest in purchasing or leasing. MLS Property Information Network, Inc. and its subscribers disclaim any and all representations and warranties as to the accuracy of the property listing data and information, or as to the accuracy of any of the Images, set forth herein.
The property listing data and information, or the Images, set forth herein were provided to MLS Property Information Network, Inc. from third party sources, including sellers, lessors and public records, and were compiled by MLS Property Information Network, Inc. The property listing data and information, and the Images, are for the personal, non-commercial use of consumers having a good faith interest in purchasing or leasing listed properties of the type displayed to them and may not be used for any purpose other than to identify prospective properties which such consumers may have a good faith interest in purchasing or leasing. MLS Property Information Network, Inc. and its subscribers disclaim any and all representations and warranties as to the accuracy of the property listing data and information, or as to the accuracy of any of the Images, set forth herein.