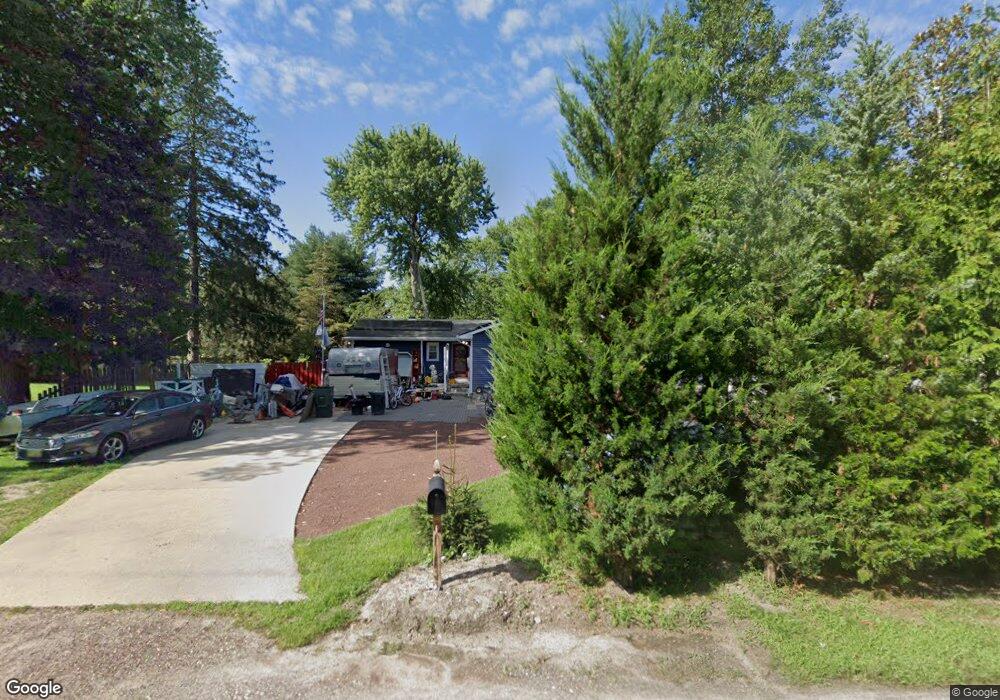
75 Clarks Landing Rd Port Republic, NJ 08241
Estimated Value: $265,493 - $376,000
--
Bed
--
Bath
1,340
Sq Ft
$251/Sq Ft
Est. Value
About This Home
This home is located at 75 Clarks Landing Rd, Port Republic, NJ 08241 and is currently estimated at $336,123, approximately $250 per square foot. 75 Clarks Landing Rd is a home located in Atlantic County with nearby schools including Port Republic Elementary School and Jersey Shore Baptist Academy.
Ownership History
Date
Name
Owned For
Owner Type
Purchase Details
Closed on
Jun 10, 2021
Sold by
Stratton Jock K and Stratton Jane A
Bought by
Stratton Jock K and Stratton Jane A
Current Estimated Value
Home Financials for this Owner
Home Financials are based on the most recent Mortgage that was taken out on this home.
Original Mortgage
$125,000
Interest Rate
2.2%
Mortgage Type
New Conventional
Purchase Details
Closed on
May 28, 1999
Sold by
Piotrowski Thomas T and Piotrowski Kathryn
Bought by
Stratton Jock K
Home Financials for this Owner
Home Financials are based on the most recent Mortgage that was taken out on this home.
Original Mortgage
$116,043
Interest Rate
6.85%
Mortgage Type
FHA
Purchase Details
Closed on
Jun 29, 1990
Sold by
Lincoln Robert W and Lincoln George W
Bought by
Piotrowski Thomas T and Piotrowski Kathryn
Create a Home Valuation Report for This Property
The Home Valuation Report is an in-depth analysis detailing your home's value as well as a comparison with similar homes in the area
Home Values in the Area
Average Home Value in this Area
Purchase History
| Date | Buyer | Sale Price | Title Company |
|---|---|---|---|
| Stratton Jock K | -- | None Listed On Document | |
| Stratton Jock K | $117,000 | The Title Company | |
| Piotrowski Thomas T | $115,000 | -- |
Source: Public Records
Mortgage History
| Date | Status | Borrower | Loan Amount |
|---|---|---|---|
| Previous Owner | Stratton Jock K | $125,000 | |
| Previous Owner | Stratton Jock K | $116,043 |
Source: Public Records
Tax History Compared to Growth
Tax History
| Year | Tax Paid | Tax Assessment Tax Assessment Total Assessment is a certain percentage of the fair market value that is determined by local assessors to be the total taxable value of land and additions on the property. | Land | Improvement |
|---|---|---|---|---|
| 2025 | $5,221 | $154,500 | $49,400 | $105,100 |
| 2024 | $5,221 | $154,500 | $49,400 | $105,100 |
| 2023 | $4,610 | $154,500 | $49,400 | $105,100 |
| 2022 | $4,610 | $154,500 | $49,400 | $105,100 |
| 2021 | $4,391 | $154,500 | $49,400 | $105,100 |
| 2020 | $4,286 | $154,500 | $49,400 | $105,100 |
| 2019 | $4,142 | $154,500 | $49,400 | $105,100 |
| 2018 | $4,141 | $154,500 | $49,400 | $105,100 |
| 2017 | $4,073 | $154,500 | $49,400 | $105,100 |
| 2016 | $4,018 | $108,100 | $26,700 | $81,400 |
| 2015 | $4,005 | $108,100 | $26,700 | $81,400 |
| 2014 | $3,915 | $108,100 | $26,700 | $81,400 |
Source: Public Records
Map
Nearby Homes
- 132 Clarks Landing Rd
- 56 Main St
- 17 Main St
- 216 Old New York Rd
- 225 Chestnut Neck Rd
- 216 Riverside Dr
- 333 Cologne Port Rd
- 332 Cologne Port Rd
- 511 Chestnut Neck Rd
- 5 Fulham St
- 254 W Cologne Port Republic Rd
- 16 Holly Creek Rd
- 166 Blackburn St
- 106 E Moss Mill Rd Unit 38
- 106 E Moss Mill Rd Unit T-34
- 709 Lindbergh Ave
- 9 Wicklow Terrace
- 30 Wordsworth St
- B:1223/L:11.02 N New York Rd
- B:1223/L:10.02 N New York
- 69 Clarks Landing Rd
- 132 Blakes Ln
- 126 Blakes Ln
- 80 Clarks Landing Rd
- 65 Clarks Landing Rd
- 70 Clarks Landing Rd
- 122 Blakes Ln
- 61 Clarks Landing Rd
- 62 Clarks Landing Rd
- 121 Clarks Landing Rd
- 64 Clarks Landing Rd
- 53 Clarks Landing Rd
- 92 Clarks Landing Rd
- 113 Blakes Ln
- 52 Clarks Landing Rd
- 46 Clarks Landing Rd
- 73 Adams Ave
- 63 Adams Ave
- 58 Pomona Ave
- 83 Adams Ave