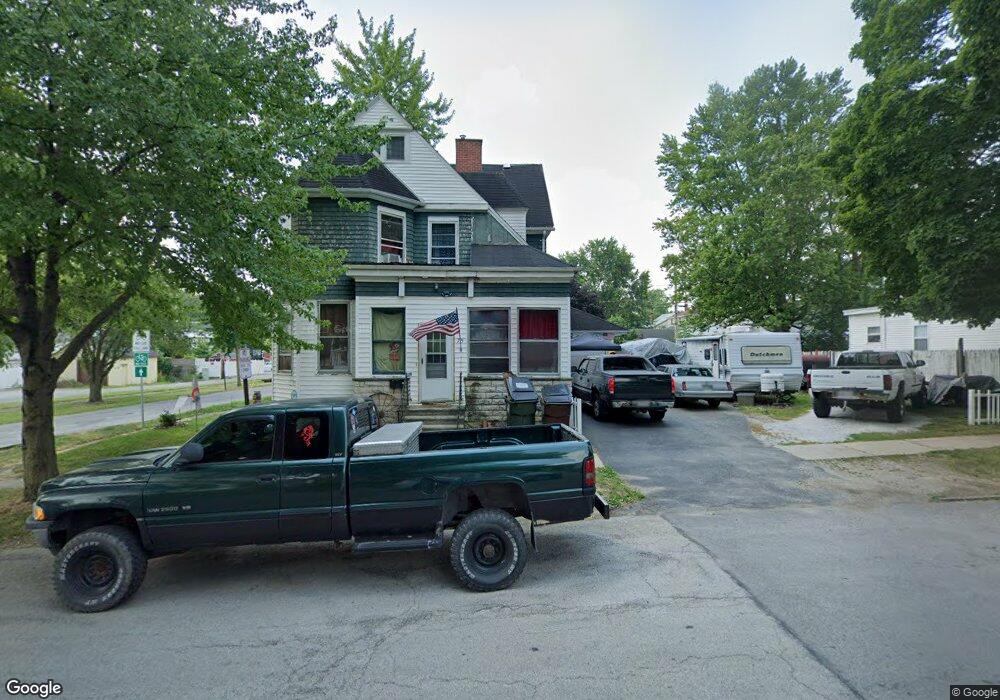
75 Clay St Tiffin, OH 44883
Estimated Value: $148,000 - $187,000
4
Beds
2
Baths
1,944
Sq Ft
$85/Sq Ft
Est. Value
About This Home
This home is located at 75 Clay St, Tiffin, OH 44883 and is currently estimated at $164,406, approximately $84 per square foot. 75 Clay St is a home located in Seneca County with nearby schools including Columbian High School, Calvert Catholic Elementary School, and Calvert High School.
Ownership History
Date
Name
Owned For
Owner Type
Purchase Details
Closed on
Sep 12, 2006
Sold by
Aller Daniel E
Bought by
Aller Robbyne F
Current Estimated Value
Purchase Details
Closed on
Nov 15, 2004
Sold by
Gill Rodger L
Bought by
Aller Robbyne F
Purchase Details
Closed on
Sep 19, 2001
Sold by
Walland William E and Walland Andrea E
Bought by
Walland William E
Purchase Details
Closed on
Aug 17, 1998
Sold by
Kimble Dwight C
Bought by
Walland William E and Walland Andrea E
Create a Home Valuation Report for This Property
The Home Valuation Report is an in-depth analysis detailing your home's value as well as a comparison with similar homes in the area
Home Values in the Area
Average Home Value in this Area
Purchase History
| Date | Buyer | Sale Price | Title Company |
|---|---|---|---|
| Aller Robbyne F | -- | None Available | |
| Aller Robbyne F | $120,000 | -- | |
| Walland William E | -- | -- | |
| Walland William E | $68,000 | -- |
Source: Public Records
Tax History Compared to Growth
Tax History
| Year | Tax Paid | Tax Assessment Tax Assessment Total Assessment is a certain percentage of the fair market value that is determined by local assessors to be the total taxable value of land and additions on the property. | Land | Improvement |
|---|---|---|---|---|
| 2024 | $2,808 | $55,020 | $5,340 | $49,680 |
| 2023 | $2,806 | $55,020 | $5,340 | $49,680 |
| 2022 | $2,221 | $39,450 | $4,640 | $34,810 |
| 2021 | $2,219 | $39,450 | $4,640 | $34,810 |
| 2020 | $2,491 | $39,452 | $4,641 | $34,811 |
| 2019 | $2,597 | $37,867 | $4,456 | $33,411 |
| 2018 | $2,494 | $37,867 | $4,456 | $33,411 |
| 2017 | $2,400 | $37,867 | $4,456 | $33,411 |
| 2016 | $2,282 | $36,100 | $4,323 | $31,777 |
| 2015 | $2,225 | $36,100 | $4,323 | $31,777 |
| 2014 | $2,146 | $36,100 | $4,323 | $31,777 |
| 2013 | $1,771 | $37,216 | $4,456 | $32,760 |
Source: Public Records
Map
Nearby Homes