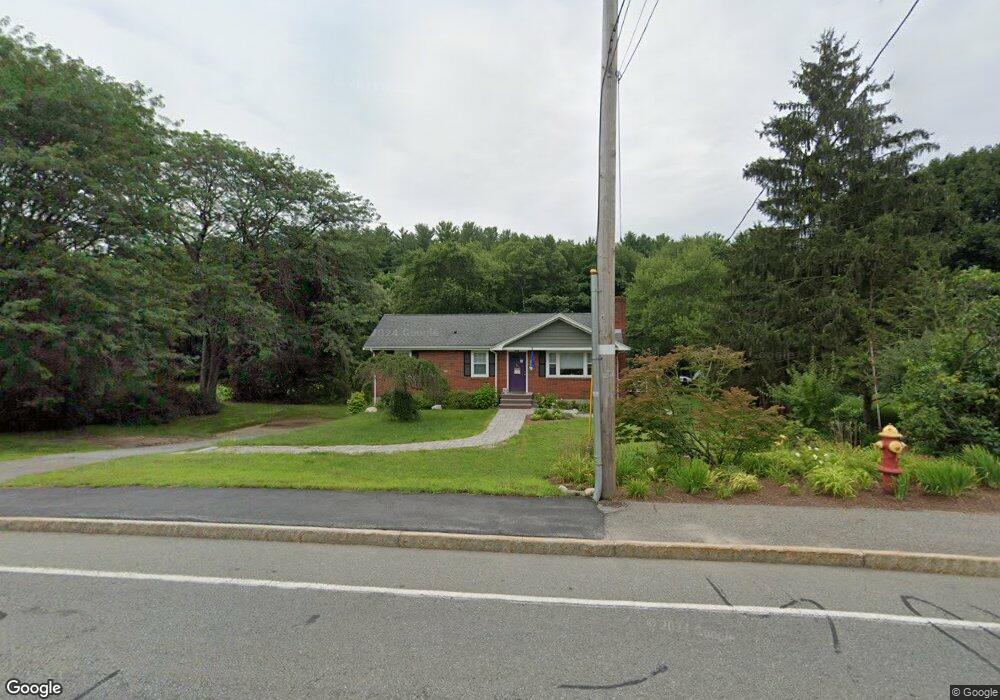
75 Cook St Billerica, MA 01821
Pinehurst NeighborhoodEstimated Value: $440,000 - $693,149
3
Beds
1
Bath
912
Sq Ft
$604/Sq Ft
Est. Value
About This Home
This home is located at 75 Cook St, Billerica, MA 01821 and is currently estimated at $551,037, approximately $604 per square foot. 75 Cook St is a home located in Middlesex County with nearby schools including Billerica Memorial High School and Burlington Montessori School.
Ownership History
Date
Name
Owned For
Owner Type
Purchase Details
Closed on
Feb 3, 2017
Sold by
Harriet Properties Llc
Bought by
Fuller Dawn-Marie
Current Estimated Value
Home Financials for this Owner
Home Financials are based on the most recent Mortgage that was taken out on this home.
Original Mortgage
$235,000
Outstanding Balance
$195,112
Interest Rate
4.3%
Mortgage Type
New Conventional
Estimated Equity
$355,925
Purchase Details
Closed on
Oct 13, 2016
Sold by
Harris Ida F Est
Bought by
Harriet Properties Llc
Purchase Details
Closed on
Feb 6, 1963
Bought by
Harris William F and Harris Ida
Create a Home Valuation Report for This Property
The Home Valuation Report is an in-depth analysis detailing your home's value as well as a comparison with similar homes in the area
Home Values in the Area
Average Home Value in this Area
Purchase History
| Date | Buyer | Sale Price | Title Company |
|---|---|---|---|
| Fuller Dawn-Marie | $250,000 | -- | |
| Harriet Properties Llc | $202,000 | -- | |
| Harris William F | -- | -- |
Source: Public Records
Mortgage History
| Date | Status | Borrower | Loan Amount |
|---|---|---|---|
| Open | Fuller Dawn-Marie | $235,000 |
Source: Public Records
Tax History Compared to Growth
Tax History
| Year | Tax Paid | Tax Assessment Tax Assessment Total Assessment is a certain percentage of the fair market value that is determined by local assessors to be the total taxable value of land and additions on the property. | Land | Improvement |
|---|---|---|---|---|
| 2025 | $5,750 | $505,700 | $359,400 | $146,300 |
| 2024 | $5,214 | $461,800 | $324,500 | $137,300 |
| 2023 | $4,959 | $417,800 | $283,100 | $134,700 |
| 2022 | $4,606 | $364,400 | $248,300 | $116,100 |
| 2021 | $4,388 | $337,500 | $226,500 | $111,000 |
| 2020 | $4,041 | $328,800 | $217,800 | $111,000 |
| 2019 | $2,910 | $309,800 | $204,700 | $105,100 |
| 2018 | $4,240 | $294,300 | $185,100 | $109,200 |
| 2017 | $3,924 | $278,500 | $178,600 | $99,900 |
| 2016 | $3,857 | $272,800 | $172,900 | $99,900 |
| 2015 | $3,697 | $263,300 | $163,400 | $99,900 |
| 2014 | $3,737 | $261,500 | $161,600 | $99,900 |
Source: Public Records
Map
Nearby Homes