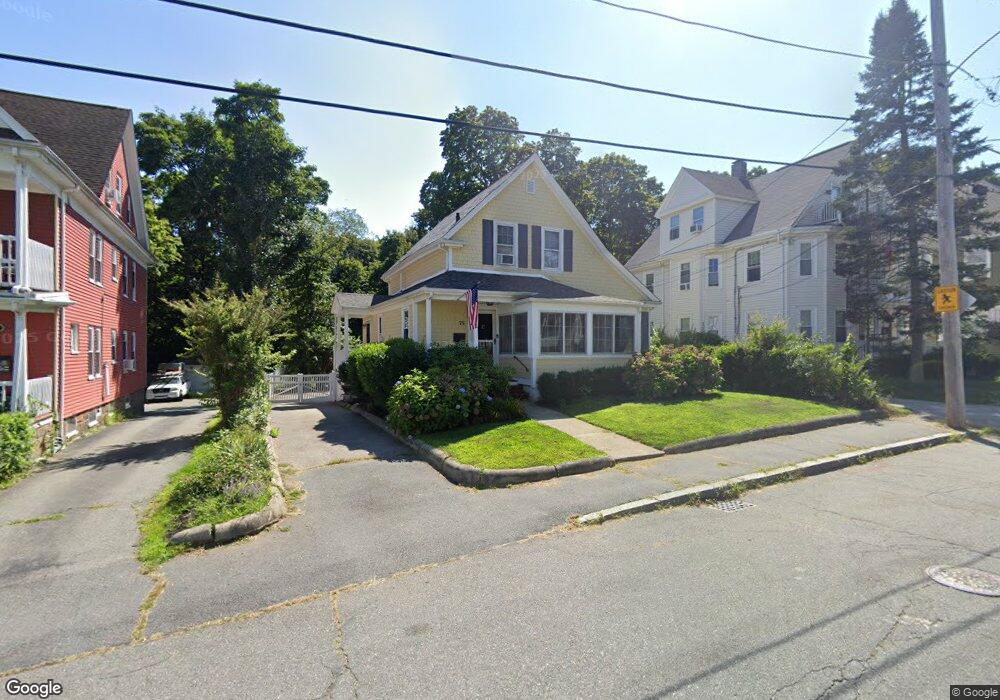
75 Cranch St Quincy, MA 02169
Quincy Center NeighborhoodEstimated Value: $740,834 - $779,000
4
Beds
2
Baths
1,667
Sq Ft
$458/Sq Ft
Est. Value
About This Home
This home is located at 75 Cranch St, Quincy, MA 02169 and is currently estimated at $762,709, approximately $457 per square foot. 75 Cranch St is a home located in Norfolk County with nearby schools including Charles A. Bernazzani Elementary School, Central Middle School, and Quincy High School.
Ownership History
Date
Name
Owned For
Owner Type
Purchase Details
Closed on
May 14, 2009
Sold by
Johnson Ft and Johnson Kenneth W
Bought by
Ellmore Steven
Current Estimated Value
Home Financials for this Owner
Home Financials are based on the most recent Mortgage that was taken out on this home.
Original Mortgage
$291,200
Outstanding Balance
$183,987
Interest Rate
4.85%
Mortgage Type
Purchase Money Mortgage
Estimated Equity
$578,722
Create a Home Valuation Report for This Property
The Home Valuation Report is an in-depth analysis detailing your home's value as well as a comparison with similar homes in the area
Home Values in the Area
Average Home Value in this Area
Purchase History
| Date | Buyer | Sale Price | Title Company |
|---|---|---|---|
| Ellmore Steven | $364,000 | -- |
Source: Public Records
Mortgage History
| Date | Status | Borrower | Loan Amount |
|---|---|---|---|
| Open | Ellmore Steven | $291,200 |
Source: Public Records
Tax History
| Year | Tax Paid | Tax Assessment Tax Assessment Total Assessment is a certain percentage of the fair market value that is determined by local assessors to be the total taxable value of land and additions on the property. | Land | Improvement |
|---|---|---|---|---|
| 2025 | $7,122 | $617,700 | $310,300 | $307,400 |
| 2024 | $6,544 | $580,700 | $295,700 | $285,000 |
| 2023 | $6,001 | $539,200 | $269,100 | $270,100 |
| 2022 | $6,255 | $522,100 | $244,900 | $277,200 |
| 2021 | $5,966 | $491,400 | $244,900 | $246,500 |
| 2020 | $5,820 | $468,200 | $233,300 | $234,900 |
| 2019 | $5,654 | $450,500 | $220,300 | $230,200 |
| 2018 | $5,730 | $429,500 | $220,300 | $209,200 |
| 2017 | $5,667 | $399,900 | $210,000 | $189,900 |
| 2016 | $5,401 | $376,100 | $200,100 | $176,000 |
| 2015 | $5,276 | $361,400 | $200,100 | $161,300 |
| 2014 | $4,983 | $335,300 | $190,700 | $144,600 |
Source: Public Records
Map
Nearby Homes
- 165 Whitwell St
- 59 Packards Ln Unit 5
- 59 Packards Ln Unit 1
- 59 Packards Ln Unit 3
- 293 Whitwell St
- 52 Packards Ln Unit 4
- 195 Thomas Burgin Pkwy Unit 212
- 195 Thomas Burgin Pkwy Unit 301
- 171-175 Granite St
- 91 Garfield St
- 18 Cliveden St Unit 406W
- 18 Cliveden St Unit 205W
- 18 Cliveden St Unit 201W
- 2 Cliveden St Unit 601E
- 2 Cliveden St Unit 405E
- 1 Cityview Ln Unit 707
- 21 Arthur St
- 12 Nelson St
- 8 Jackson St Unit B1
- 8 Jackson St Unit B4
- 71 Cranch St Unit 71
- 71 Cranch St Unit 69
- 73 Cranch St
- 71 Cranch St
- 69 Cranch St
- 69 Cranch St Unit 69
- 73 Cranch St Unit 1
- 69 Cranch St Unit 3
- 79 Cranch St Unit 2
- 79 Cranch St
- 81 Cranch St Unit 1
- 81 Cranch St
- 79-81 Cranch Unit 2
- 79 Cranch St
- 79-81 Cranch Unit 1
- 67 Cranch St
- 83 Cranch St
- 83 Cranch St Unit 2
- 85 Cranch St
- 85 Cranch St Unit 1
Your Personal Tour Guide
Ask me questions while you tour the home.