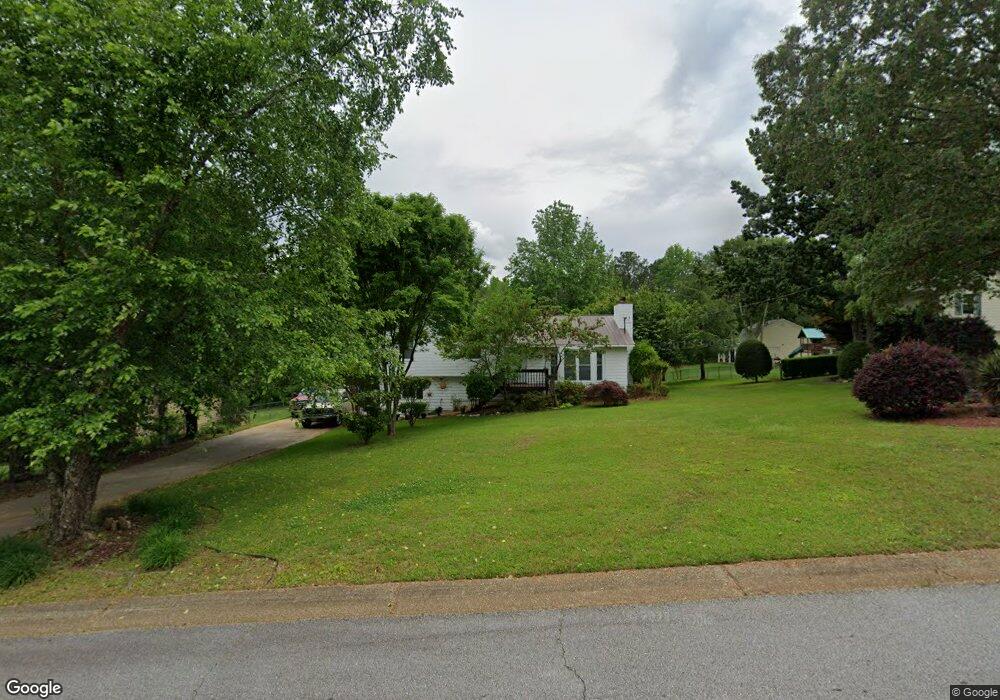
75 Cypress Cir Carrollton, GA 30116
Estimated Value: $211,000 - $263,000
3
Beds
2
Baths
1,392
Sq Ft
$176/Sq Ft
Est. Value
About This Home
This home is located at 75 Cypress Cir, Carrollton, GA 30116 and is currently estimated at $244,977, approximately $175 per square foot. 75 Cypress Cir is a home located in Carroll County with nearby schools including Whitesburg Elementary School, Central Middle School, and Central High School.
Ownership History
Date
Name
Owned For
Owner Type
Purchase Details
Closed on
Dec 17, 2007
Sold by
Tcif Reo2
Bought by
Chavez Martin M
Current Estimated Value
Home Financials for this Owner
Home Financials are based on the most recent Mortgage that was taken out on this home.
Original Mortgage
$87,900
Outstanding Balance
$55,378
Interest Rate
6.21%
Mortgage Type
New Conventional
Estimated Equity
$189,599
Purchase Details
Closed on
May 1, 2007
Sold by
Schevers Latisha
Bought by
Tcif Reo2
Purchase Details
Closed on
Sep 2, 1999
Sold by
Mcdowell Trudy T
Bought by
Mcdowell Trudy T
Purchase Details
Closed on
Jan 28, 1999
Sold by
Nationscredit Fin
Bought by
Mcdowell Trudy T
Purchase Details
Closed on
Jan 5, 1999
Sold by
Gray Roger and Gray Taleah
Bought by
Nationscredit Fin
Purchase Details
Closed on
May 27, 1994
Sold by
Scott Stephenie
Bought by
Gray Roger and Gray Taleah
Create a Home Valuation Report for This Property
The Home Valuation Report is an in-depth analysis detailing your home's value as well as a comparison with similar homes in the area
Home Values in the Area
Average Home Value in this Area
Purchase History
| Date | Buyer | Sale Price | Title Company |
|---|---|---|---|
| Chavez Martin M | $87,900 | -- | |
| Tcif Reo2 | $106,865 | -- | |
| Mcdowell Trudy T | -- | -- | |
| Schevers Cory L | $80,000 | -- | |
| Mcdowell Trudy T | $60,700 | -- | |
| Nationscredit Fin | $69,900 | -- | |
| Gray Roger | $67,400 | -- |
Source: Public Records
Mortgage History
| Date | Status | Borrower | Loan Amount |
|---|---|---|---|
| Open | Chavez Martin M | $87,900 |
Source: Public Records
Tax History Compared to Growth
Tax History
| Year | Tax Paid | Tax Assessment Tax Assessment Total Assessment is a certain percentage of the fair market value that is determined by local assessors to be the total taxable value of land and additions on the property. | Land | Improvement |
|---|---|---|---|---|
| 2024 | $2,034 | $89,894 | $6,000 | $83,894 |
| 2023 | $2,034 | $82,313 | $6,000 | $76,313 |
| 2022 | $1,662 | $66,254 | $5,040 | $61,214 |
| 2021 | $1,475 | $57,539 | $5,040 | $52,499 |
| 2020 | $1,331 | $51,858 | $5,040 | $46,818 |
| 2019 | $1,186 | $45,838 | $5,040 | $40,798 |
| 2018 | $1,042 | $39,676 | $4,200 | $35,476 |
| 2017 | $1,045 | $39,676 | $4,200 | $35,476 |
| 2016 | $1,045 | $39,676 | $4,200 | $35,476 |
| 2015 | $836 | $29,878 | $4,200 | $25,678 |
| 2014 | $695 | $24,742 | $4,200 | $20,542 |
Source: Public Records
Map
Nearby Homes
- 2800 Georgia 16
- 2800 Sr 16
- 2716 Georgia 16
- 0 Heath Rd Unit 20173471
- 00 Heath Rd
- 0 Clem Lowell Rd Unit 10479926
- 0 Clem Lowell Rd Unit 147578
- 0 Clem Lowell Rd Unit 7630669
- 184 Whooping Creek Church Rd
- 185 White Oak Ct
- 143 Oak Leaf Dr Unit 163
- 143 Oak Leaf Dr
- 200 Heath Rd
- 2181 2201 Star Point
- 201 Little New York Rd
- 0 Bankhead Hwy and Sassafras Unit 140936
- 2033 Old Newnan Rd
- 252 Mink Hollow Dr
- 1075 Davis Rd
- 357 Old Driver Rd
- 87 Cypress Cir
- 61 Cypress Cir
- 72 Cypress Cir
- 86 Cypress Cir
- 58 Cypress Cir
- 35 Cypress Cir
- 111 Cypress Cir
- 100 Cypress Cir
- 46 Cypress Cir
- 301 Cypress Cir
- 313 Cypress Cir
- 112 Cypress Cir
- 289 Cypress Cir
- 38 Cypress Cir
- 28 Cypress Cir
- 133 Cypress Cir
- 15 Cypress Cir
- 120 Cypress Cir
- 275 Cypress Cir
- 325 Cypress Cir