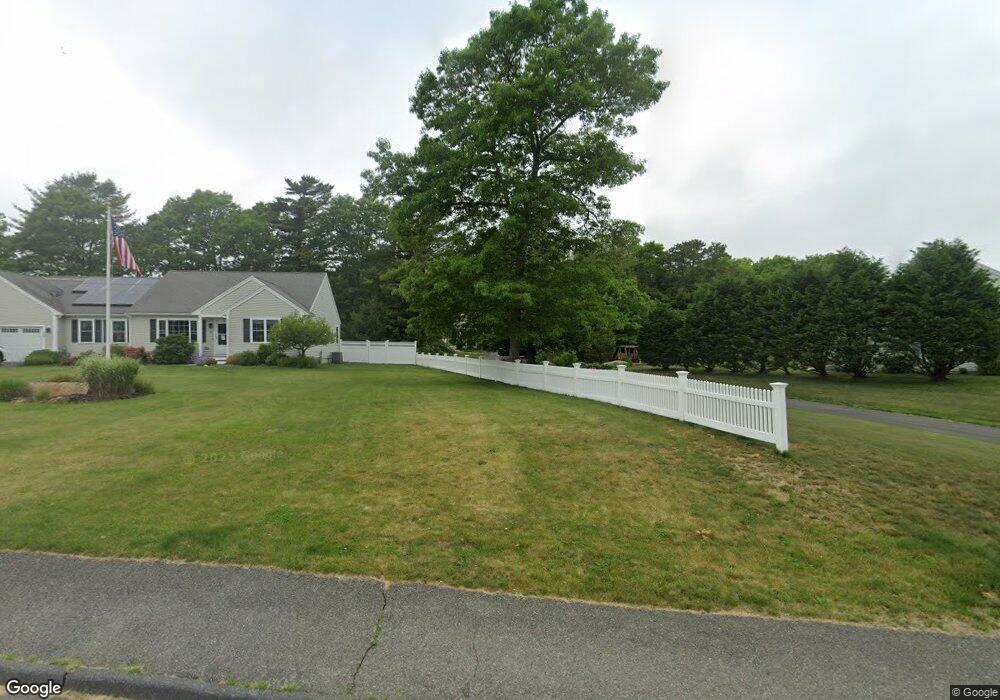
75 Deseret Dr Bourne, MA 2532
Estimated Value: $753,328 - $780,000
4
Beds
3
Baths
2,224
Sq Ft
$346/Sq Ft
Est. Value
About This Home
This home is located at 75 Deseret Dr, Bourne, MA 2532 and is currently estimated at $770,082, approximately $346 per square foot. 75 Deseret Dr is a home located in Barnstable County with nearby schools including Bourne High School and St Margaret Regional School.
Ownership History
Date
Name
Owned For
Owner Type
Purchase Details
Closed on
Jan 11, 2017
Sold by
Usa Va
Bought by
Giblin John F and Giblin Christine M
Current Estimated Value
Home Financials for this Owner
Home Financials are based on the most recent Mortgage that was taken out on this home.
Original Mortgage
$400,716
Outstanding Balance
$328,226
Interest Rate
4.08%
Mortgage Type
VA
Estimated Equity
$441,856
Purchase Details
Closed on
Sep 20, 2016
Sold by
Quicken Loans Inc
Bought by
Usa Va
Purchase Details
Closed on
Jul 16, 2010
Sold by
Pine Tree Rt and Hebb
Bought by
Pilgrim Pines Ld Llc and Adams Christin C
Home Financials for this Owner
Home Financials are based on the most recent Mortgage that was taken out on this home.
Original Mortgage
$388,170
Interest Rate
4.82%
Mortgage Type
Purchase Money Mortgage
Create a Home Valuation Report for This Property
The Home Valuation Report is an in-depth analysis detailing your home's value as well as a comparison with similar homes in the area
Purchase History
| Date | Buyer | Sale Price | Title Company |
|---|---|---|---|
| Giblin John F | $397,915 | -- | |
| Giblin John F | $397,915 | -- | |
| Giblin John F | $397,915 | -- | |
| Usa Va | -- | -- | |
| Usa Va | -- | -- | |
| Pilgrim Pines Ld Llc | $15,458 | -- | |
| Adams Darrow W | $399,900 | -- | |
| Pilgrim Pines Ld Llc | $15,458 | -- |
Source: Public Records
Mortgage History
| Date | Status | Borrower | Loan Amount |
|---|---|---|---|
| Open | Giblin John F | $400,716 | |
| Closed | Giblin John F | $400,716 | |
| Previous Owner | Adams Darrow W | $388,170 | |
| Previous Owner | Pilgrim Pines Ld Llc | $0 |
Source: Public Records
Tax History
| Year | Tax Paid | Tax Assessment Tax Assessment Total Assessment is a certain percentage of the fair market value that is determined by local assessors to be the total taxable value of land and additions on the property. | Land | Improvement |
|---|---|---|---|---|
| 2025 | $5,450 | $697,800 | $231,100 | $466,700 |
| 2024 | $5,369 | $669,500 | $220,100 | $449,400 |
| 2023 | $5,414 | $614,500 | $212,500 | $402,000 |
| 2022 | $5,152 | $510,600 | $188,100 | $322,500 |
| 2021 | $5,039 | $467,900 | $171,200 | $296,700 |
| 2020 | $4,917 | $457,800 | $169,500 | $288,300 |
| 2019 | $4,640 | $441,500 | $169,500 | $272,000 |
| 2018 | $4,463 | $423,400 | $161,500 | $261,900 |
| 2017 | $4,278 | $415,300 | $153,300 | $262,000 |
| 2016 | $3,985 | $392,200 | $140,000 | $252,200 |
| 2015 | $3,882 | $385,500 | $133,300 | $252,200 |
Source: Public Records
Map
Nearby Homes
- 24 Heather Hill Rd
- 58 Maple St
- 304 Main St
- 6 Honora Ct
- 29 Weather Deck Rd
- 3 Honora Ln Unit 3
- 24 Ships View Terrace
- 38 Old Bridge Rd
- 23 Alderberry Rd
- 810 Head of The Bay Rd
- 60 Sandwich Rd
- 9 Hideaway Rd Unit F
- 6 Aspen Rd Unit 6
- 6 Aspen Rd
- 13 Hideaway Village Unit G
- 46 Holt Rd Unit B
- 46 Holt Rd
- 10 Sandy Ln
- 7 Swamp Rd
- 150 Herring Pond Rd
Your Personal Tour Guide
Ask me questions while you tour the home.