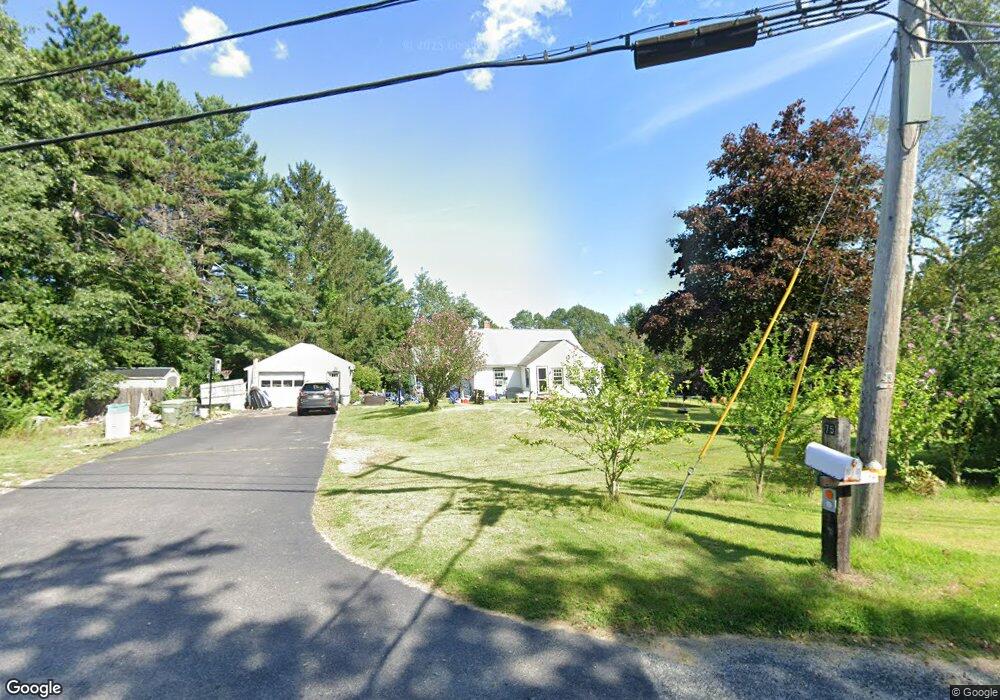
75 Dudley Rd Oxford, MA 01540
Estimated Value: $414,000 - $451,435
3
Beds
2
Baths
1,434
Sq Ft
$302/Sq Ft
Est. Value
About This Home
This home is located at 75 Dudley Rd, Oxford, MA 01540 and is currently estimated at $432,359, approximately $301 per square foot. 75 Dudley Rd is a home located in Worcester County with nearby schools including Alfred M Chaffee, Oxford High School, and Clara Barton Elementary School.
Ownership History
Date
Name
Owned For
Owner Type
Purchase Details
Closed on
Sep 19, 2007
Sold by
Reynolds Jayne H and Skeates Nancy J
Bought by
Skeates Andrew C
Current Estimated Value
Home Financials for this Owner
Home Financials are based on the most recent Mortgage that was taken out on this home.
Original Mortgage
$226,000
Outstanding Balance
$143,527
Interest Rate
6.63%
Mortgage Type
Purchase Money Mortgage
Estimated Equity
$288,832
Create a Home Valuation Report for This Property
The Home Valuation Report is an in-depth analysis detailing your home's value as well as a comparison with similar homes in the area
Home Values in the Area
Average Home Value in this Area
Purchase History
| Date | Buyer | Sale Price | Title Company |
|---|---|---|---|
| Skeates Andrew C | $226,000 | -- |
Source: Public Records
Mortgage History
| Date | Status | Borrower | Loan Amount |
|---|---|---|---|
| Open | Skeates Andrew C | $226,000 |
Source: Public Records
Tax History
| Year | Tax Paid | Tax Assessment Tax Assessment Total Assessment is a certain percentage of the fair market value that is determined by local assessors to be the total taxable value of land and additions on the property. | Land | Improvement |
|---|---|---|---|---|
| 2025 | $50 | $391,400 | $124,400 | $267,000 |
| 2024 | $5,012 | $371,800 | $115,100 | $256,700 |
| 2023 | $4,789 | $351,100 | $102,800 | $248,300 |
| 2022 | $4,145 | $256,500 | $73,600 | $182,900 |
| 2021 | $3,982 | $240,900 | $70,000 | $170,900 |
| 2020 | $3,828 | $229,800 | $70,000 | $159,800 |
| 2019 | $3,457 | $203,000 | $70,000 | $133,000 |
| 2018 | $3,354 | $194,200 | $70,000 | $124,200 |
| 2017 | $3,351 | $198,900 | $70,000 | $128,900 |
| 2016 | $3,367 | $198,900 | $70,000 | $128,900 |
| 2015 | $3,141 | $198,900 | $70,000 | $128,900 |
| 2014 | $3,077 | $205,100 | $70,000 | $135,100 |
Source: Public Records
Map
Nearby Homes
Your Personal Tour Guide
Ask me questions while you tour the home.