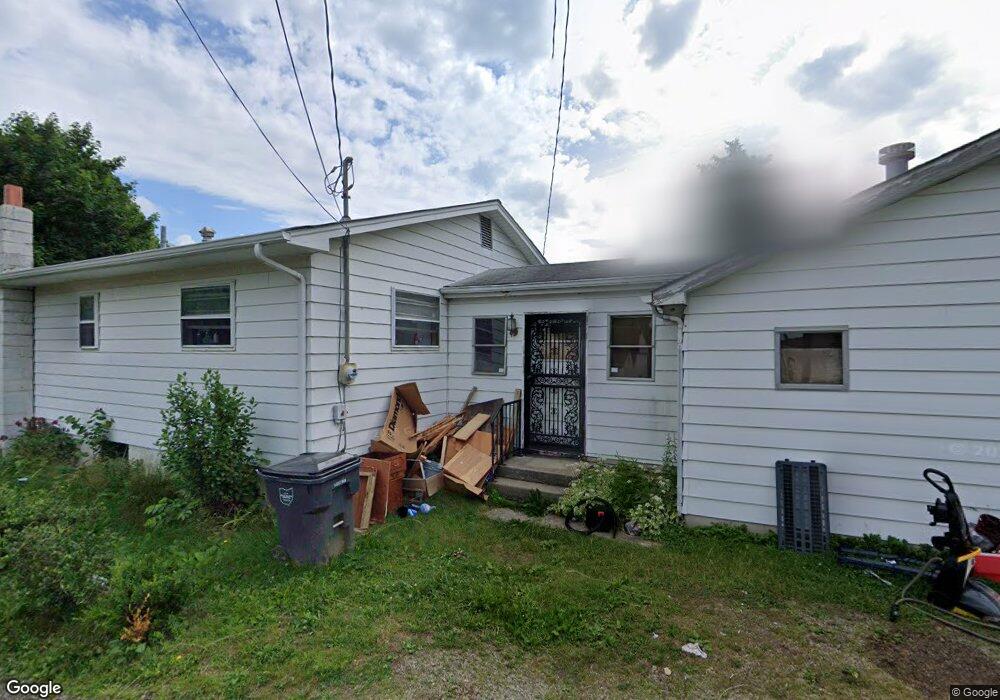
75 E Alcott Rd Columbus, OH 43207
Obetz-Lockbourne NeighborhoodEstimated Value: $181,000 - $230,000
3
Beds
1
Bath
1,239
Sq Ft
$165/Sq Ft
Est. Value
About This Home
This home is located at 75 E Alcott Rd, Columbus, OH 43207 and is currently estimated at $204,468, approximately $165 per square foot. 75 E Alcott Rd is a home located in Franklin County with nearby schools including Parsons Elementary School, Buckeye Middle School, and Marion-Franklin High School.
Ownership History
Date
Name
Owned For
Owner Type
Purchase Details
Closed on
Feb 6, 2019
Sold by
Lonestar Holdings Llc
Bought by
Cashflow Investor Usa Llc
Current Estimated Value
Home Financials for this Owner
Home Financials are based on the most recent Mortgage that was taken out on this home.
Original Mortgage
$76,200
Outstanding Balance
$66,308
Interest Rate
4.4%
Mortgage Type
Commercial
Estimated Equity
$138,160
Purchase Details
Closed on
Jan 24, 2019
Sold by
Simmons Roy L and Simmons Susan A
Bought by
Lonestar Holdings Llc
Home Financials for this Owner
Home Financials are based on the most recent Mortgage that was taken out on this home.
Original Mortgage
$76,200
Outstanding Balance
$66,308
Interest Rate
4.4%
Mortgage Type
Commercial
Estimated Equity
$138,160
Purchase Details
Closed on
Jun 14, 2012
Sold by
Beculhimer Brenda G and Beculhimer Marvin
Bought by
Simmons Roy L
Purchase Details
Closed on
Sep 25, 2008
Sold by
Simmons Mary P
Bought by
Simmons Roy L and Beculhimer Brenda G
Purchase Details
Closed on
Feb 22, 1999
Sold by
Estate Of Delma Simmons
Bought by
Simmons Mary P
Purchase Details
Closed on
Jan 17, 1967
Bought by
Simmons Delma R
Create a Home Valuation Report for This Property
The Home Valuation Report is an in-depth analysis detailing your home's value as well as a comparison with similar homes in the area
Home Values in the Area
Average Home Value in this Area
Purchase History
| Date | Buyer | Sale Price | Title Company |
|---|---|---|---|
| Cashflow Investor Usa Llc | $65,000 | Pm Title Box | |
| Lonestar Holdings Llc | $50,000 | Pm Title Box | |
| Simmons Roy L | $20,000 | None Available | |
| Simmons Roy L | -- | Attorney | |
| Simmons Mary P | -- | -- | |
| Simmons Delma R | -- | -- |
Source: Public Records
Mortgage History
| Date | Status | Borrower | Loan Amount |
|---|---|---|---|
| Open | Cashflow Investor Usa Llc | $76,200 |
Source: Public Records
Tax History
| Year | Tax Paid | Tax Assessment Tax Assessment Total Assessment is a certain percentage of the fair market value that is determined by local assessors to be the total taxable value of land and additions on the property. | Land | Improvement |
|---|---|---|---|---|
| 2025 | $2,467 | $53,830 | $13,860 | $39,970 |
| 2024 | $2,467 | $53,830 | $13,860 | $39,970 |
| 2023 | $2,436 | $53,830 | $13,860 | $39,970 |
| 2022 | $1,698 | $31,960 | $7,420 | $24,540 |
| 2021 | $1,701 | $31,960 | $7,420 | $24,540 |
| 2020 | $1,854 | $31,960 | $7,420 | $24,540 |
| 2019 | $1,731 | $27,830 | $6,440 | $21,390 |
| 2018 | $864 | $27,830 | $6,440 | $21,390 |
| 2017 | $1,730 | $27,830 | $6,440 | $21,390 |
| 2016 | $1,843 | $27,130 | $4,830 | $22,300 |
| 2015 | $839 | $27,130 | $4,830 | $22,300 |
| 2014 | $1,682 | $27,130 | $4,830 | $22,300 |
| 2013 | $924 | $28,560 | $5,075 | $23,485 |
Source: Public Records
Map
Nearby Homes
- 2741 Thorndale Ave Unit 743
- 19 E Castle Rd
- 212 E Alcott Rd
- 2676 Shelly Dr
- 272 Southard Dr
- 2501 S 6th St
- 162 Phelps Rd
- 2407 S 6th St
- 211 Delaney Dr
- 2382 S 6th St
- 228 Currier Dr
- 460 Coulter Ave
- 435 Carolann Ave
- 1633-1635 E Greenway Ave
- 83 Rumsey Rd
- 135 Rumsey Rd
- 611 Lock Ave
- 3380 Parsons Ave
- 647 Lock Ave
- 546 Stambaugh Ave
- 81 E Alcott Rd
- 0 E Alcott Rd
- 2740 Thorndale Ave
- 2724 Thorndale Ave
- 89 E Alcott Rd
- 2754 Thorndale Ave
- 91 E Alcott Rd
- 82 Cullman Rd
- 74 E Alcott Rd
- 86 E Alcott Rd
- 2710 Thorndale Ave
- 2760 Thorndale Ave
- 90 Cullman Rd
- 92 E Alcott Rd
- 98 E Alcott Rd
- 111 E Alcott Rd
- 98 Cullman Rd
- 2764 Thorndale Ave
- 2706 Thorndale Ave
- 0 E Alcott Rd
Your Personal Tour Guide
Ask me questions while you tour the home.