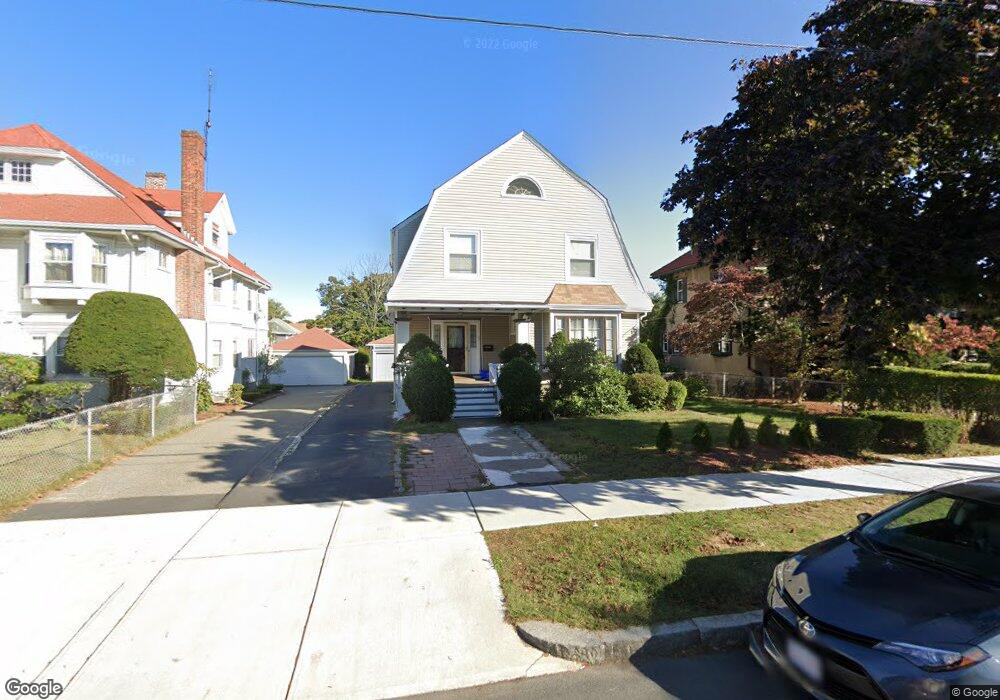
75 Elm Ave Unit rear Quincy, MA 02170
Wollaston NeighborhoodEstimated Value: $953,000 - $1,223,000
1
Bed
1
Bath
500
Sq Ft
$2,101/Sq Ft
Est. Value
About This Home
This home is located at 75 Elm Ave Unit rear, Quincy, MA 02170 and is currently estimated at $1,050,331, approximately $2,100 per square foot. 75 Elm Ave Unit rear is a home located in Norfolk County with nearby schools including Beechwood Knoll Elementary School, Central Middle School, and North Quincy High School.
Ownership History
Date
Name
Owned For
Owner Type
Purchase Details
Closed on
Oct 25, 2013
Sold by
Elm Avenue Rt
Bought by
Zhu Jian H and Zhu Qing H
Current Estimated Value
Purchase Details
Closed on
Apr 19, 2006
Sold by
Butts Lorraine A
Bought by
Elm Ave Rt and Butts Lorraine A
Create a Home Valuation Report for This Property
The Home Valuation Report is an in-depth analysis detailing your home's value as well as a comparison with similar homes in the area
Home Values in the Area
Average Home Value in this Area
Purchase History
| Date | Buyer | Sale Price | Title Company |
|---|---|---|---|
| Zhu Jian H | $490,000 | -- | |
| Elm Ave Rt | -- | -- | |
| Butts Lorraine | -- | -- | |
| Butts Lorraine | -- | -- |
Source: Public Records
Mortgage History
| Date | Status | Borrower | Loan Amount |
|---|---|---|---|
| Previous Owner | Butts Lorraine | $103,000 | |
| Previous Owner | Butts Lorraine | $60,000 | |
| Previous Owner | Butts Lorraine | $125,000 |
Source: Public Records
Tax History Compared to Growth
Tax History
| Year | Tax Paid | Tax Assessment Tax Assessment Total Assessment is a certain percentage of the fair market value that is determined by local assessors to be the total taxable value of land and additions on the property. | Land | Improvement |
|---|---|---|---|---|
| 2025 | $10,423 | $904,000 | $358,100 | $545,900 |
| 2024 | $10,011 | $888,300 | $358,100 | $530,200 |
| 2023 | $9,673 | $869,100 | $341,000 | $528,100 |
| 2022 | $9,366 | $781,800 | $272,900 | $508,900 |
| 2021 | $8,743 | $720,200 | $272,900 | $447,300 |
| 2020 | $8,915 | $717,200 | $272,900 | $444,300 |
| 2019 | $8,406 | $669,800 | $255,000 | $414,800 |
| 2018 | $8,352 | $626,100 | $231,800 | $394,300 |
| 2017 | $7,429 | $524,300 | $231,800 | $292,500 |
| 2016 | $6,916 | $481,600 | $210,700 | $270,900 |
| 2015 | $6,948 | $475,900 | $191,600 | $284,300 |
| 2014 | $6,855 | $461,300 | $182,400 | $278,900 |
Source: Public Records
Map
Nearby Homes
- 65 - 67 Davis St
- 14 Ridgeway St
- 41 Randlett St
- 123 Waterston Ave
- 101 Beach St
- 158 W Elm Ave
- 176 W Elm Ave
- 72 Waterston Ave
- 22 Beach St
- 43 Ellington Rd
- 237 Billings Rd
- 100 Thornton St
- 26 Buckingham Rd
- 522 Hancock St
- 35 Estabrook Rd
- 511 Hancock St Unit 207
- 21 Linden St Unit 417
- 55 Warren Ave
- 22 Newton Ave
- 143 Arlington St