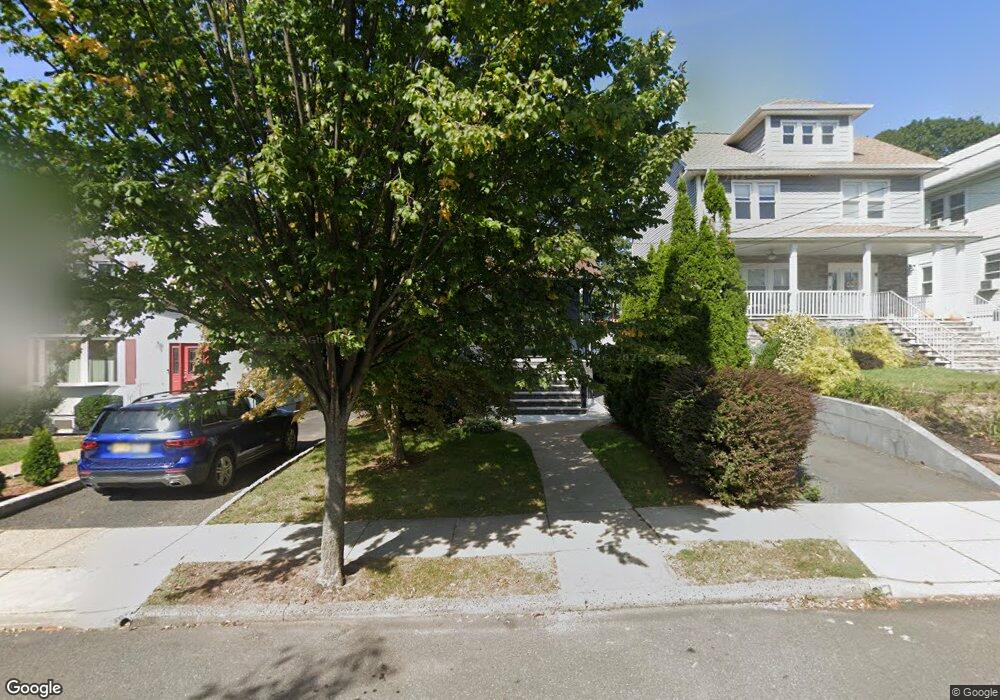
75 Elm Place Nutley, NJ 07110
Estimated Value: $683,000 - $936,000
--
Bed
--
Bath
1,980
Sq Ft
$398/Sq Ft
Est. Value
About This Home
This home is located at 75 Elm Place, Nutley, NJ 07110 and is currently estimated at $787,910, approximately $397 per square foot. 75 Elm Place is a home located in Essex County with nearby schools including Nutley High School, St Clare Elementary School, and Abundant Life Academy.
Ownership History
Date
Name
Owned For
Owner Type
Purchase Details
Closed on
Apr 26, 2016
Sold by
Lupo Cynthia M and Lupo William A
Bought by
Ponte Aramis and Proenza Ponte Crystal
Current Estimated Value
Home Financials for this Owner
Home Financials are based on the most recent Mortgage that was taken out on this home.
Original Mortgage
$378,000
Outstanding Balance
$301,403
Interest Rate
3.71%
Mortgage Type
New Conventional
Estimated Equity
$486,507
Create a Home Valuation Report for This Property
The Home Valuation Report is an in-depth analysis detailing your home's value as well as a comparison with similar homes in the area
Home Values in the Area
Average Home Value in this Area
Purchase History
| Date | Buyer | Sale Price | Title Company |
|---|---|---|---|
| Ponte Aramis | $420,000 | Commonwealth Land Title Co |
Source: Public Records
Mortgage History
| Date | Status | Borrower | Loan Amount |
|---|---|---|---|
| Open | Ponte Aramis | $378,000 |
Source: Public Records
Tax History Compared to Growth
Tax History
| Year | Tax Paid | Tax Assessment Tax Assessment Total Assessment is a certain percentage of the fair market value that is determined by local assessors to be the total taxable value of land and additions on the property. | Land | Improvement |
|---|---|---|---|---|
| 2025 | $14,444 | $560,700 | $243,000 | $317,700 |
| 2024 | $14,444 | $560,700 | $243,000 | $317,700 |
| 2022 | $14,378 | $372,100 | $203,000 | $169,100 |
| 2021 | $14,304 | $372,100 | $203,000 | $169,100 |
| 2020 | $13,325 | $361,900 | $203,000 | $158,900 |
| 2019 | $13,057 | $361,900 | $203,000 | $158,900 |
| 2018 | $12,706 | $361,900 | $203,000 | $158,900 |
| 2017 | $12,569 | $361,900 | $203,000 | $158,900 |
| 2016 | $11,744 | $348,500 | $203,000 | $145,500 |
| 2015 | $11,556 | $348,500 | $203,000 | $145,500 |
| 2014 | $11,410 | $348,500 | $203,000 | $145,500 |
Source: Public Records
Map
Nearby Homes
- 20 Saint Pauls Place
- 132 Brookfield Ave
- 97 Glendale St
- 532 Passaic Ave
- 688 Passaic Ave
- 274 Kingsland St
- 18 Brookfield Ave
- 63 Lakeside Dr
- 68 Cathedral Ave
- 13 Ruth Ave
- 36 Lake St
- 25 Lake St
- 296 Highfield Ln
- 19 Howe Ave
- 90 Ardmore Ave
- 51 Kensington Ave
- 47 Funston Place
- 65 Enclosure St
- 621 Bloomfield Ave