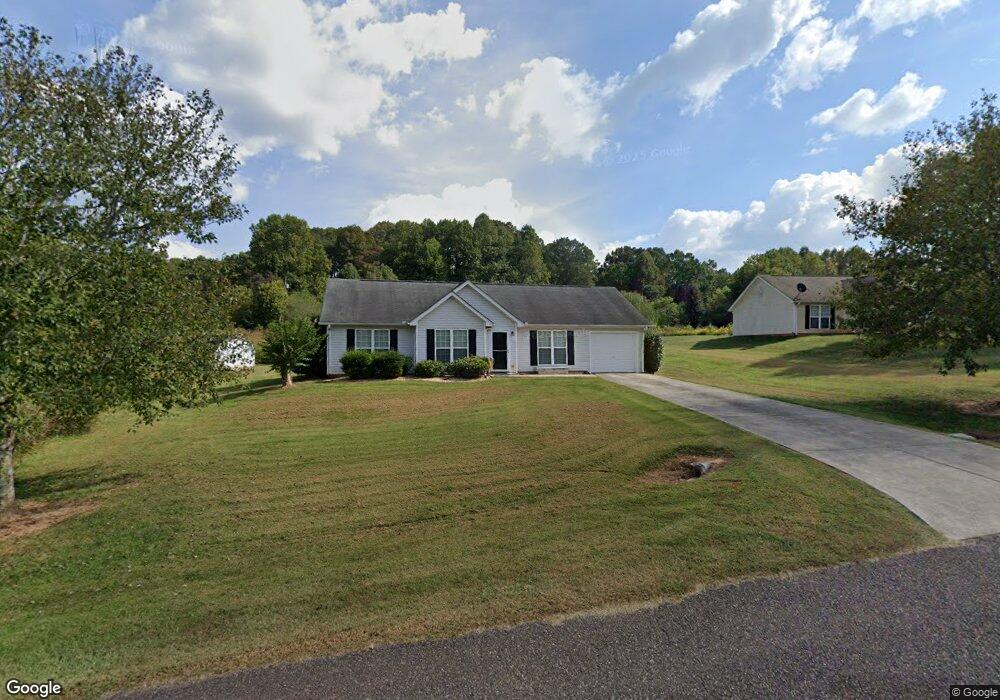
75 Farm View Ln Dahlonega, GA 30533
Estimated Value: $275,000 - $321,000
--
Bed
2
Baths
1,257
Sq Ft
$234/Sq Ft
Est. Value
About This Home
This home is located at 75 Farm View Ln, Dahlonega, GA 30533 and is currently estimated at $294,272, approximately $234 per square foot. 75 Farm View Ln is a home located in Lumpkin County with nearby schools including Clay County Middle School and Lumpkin County High School.
Ownership History
Date
Name
Owned For
Owner Type
Purchase Details
Closed on
Oct 13, 2017
Sold by
Nunley Anthony P
Bought by
Nunley Rentals Llc
Current Estimated Value
Purchase Details
Closed on
Nov 30, 2011
Sold by
Nunley Robbie B
Bought by
Nunley Anthony P
Purchase Details
Closed on
Apr 13, 2009
Sold by
Nunley Anthony P
Bought by
Nunley Robbie B
Purchase Details
Closed on
Jun 29, 2007
Sold by
Not Provided
Bought by
Nunley Robbie B
Home Financials for this Owner
Home Financials are based on the most recent Mortgage that was taken out on this home.
Original Mortgage
$100,720
Interest Rate
6.37%
Mortgage Type
New Conventional
Purchase Details
Closed on
Jun 2, 2006
Sold by
Not Provided
Bought by
Nunley Robbie B
Purchase Details
Closed on
May 25, 2006
Sold by
Not Provided
Bought by
Nunley Robbie B
Purchase Details
Closed on
Mar 25, 1996
Bought by
Grizzle Tracy L and Grizzle Brenda A
Create a Home Valuation Report for This Property
The Home Valuation Report is an in-depth analysis detailing your home's value as well as a comparison with similar homes in the area
Home Values in the Area
Average Home Value in this Area
Purchase History
| Date | Buyer | Sale Price | Title Company |
|---|---|---|---|
| Nunley Rentals Llc | -- | -- | |
| Nunley Anthony P | -- | -- | |
| Nunley Robbie B | -- | -- | |
| Nunley Robbie B | $125,900 | -- | |
| Nunley Robbie B | -- | -- | |
| Nunley Robbie B | $336,600 | -- | |
| Grizzle Tracy L | $235,000 | -- |
Source: Public Records
Mortgage History
| Date | Status | Borrower | Loan Amount |
|---|---|---|---|
| Previous Owner | Nunley Robbie B | $100,720 |
Source: Public Records
Tax History Compared to Growth
Tax History
| Year | Tax Paid | Tax Assessment Tax Assessment Total Assessment is a certain percentage of the fair market value that is determined by local assessors to be the total taxable value of land and additions on the property. | Land | Improvement |
|---|---|---|---|---|
| 2024 | $2,205 | $92,193 | $8,000 | $84,193 |
| 2023 | $2,017 | $85,769 | $8,000 | $77,769 |
| 2022 | $1,772 | $71,576 | $8,000 | $63,576 |
| 2021 | $1,516 | $59,231 | $8,000 | $51,231 |
| 2020 | $1,517 | $57,508 | $8,000 | $49,508 |
| 2019 | $1,531 | $57,508 | $8,000 | $49,508 |
| 2018 | $1,459 | $51,441 | $8,000 | $43,441 |
| 2017 | $1,378 | $47,628 | $8,000 | $39,628 |
| 2016 | $1,099 | $36,740 | $6,000 | $30,740 |
| 2015 | $977 | $36,740 | $6,000 | $30,740 |
| 2014 | $977 | $37,076 | $6,000 | $31,076 |
| 2013 | -- | $37,414 | $6,000 | $31,414 |
Source: Public Records
Map
Nearby Homes
- 1323 Cavender Creek Rd
- 165 Porter Springs Rd
- 03 Kate Rd
- 0 Porter Springs Rd Unit 7685063
- 0 Porter Springs Rd Unit 10648400
- 00 LOT C Cavender Creek Rd
- 372 Porter Springs Rd
- 85 Summit Canyon Rd Unit H102
- 34 Great Works Dr
- 496 Beaver Dam Rd
- 302 Pointe Cir
- 00 Cavender Creek Rd
- 2589 Morrison Moore Pkwy E
- 1437 Porter Springs Rd
- 4039 Highway 19 N
- 238 Grand View St
- 7.123 Acres Halls Mill Rd
- 65 Golden Autumn Dr
- 00 Captain McDonald Rd
- 149 Highland Rd S
- 125 Farm View Ln
- 112 Farm View Ln
- 0 Farm View Ln
- 65 Farm View Ln
- 80 Farm View Ln
- 129 Farm View Ln
- 175 Fortner Dr
- 125 Fortner Dr
- 132 Farm View Ln
- 136 Farm View Ln
- 133 Farm View Ln
- 133 Farm View Ln Unit 6
- 45 Farm View Ln
- 30 Farm View Ln
- 225 Fortner Dr
- 0 Bill Anderson Rd Unit LOT 2 2849698
- 0 Bill Anderson Rd Unit LOT 2 7072553
- 0 Bill Anderson Rd Unit 8142927
- 2 Bill Anderson Rd
- 130 Fortner Dr