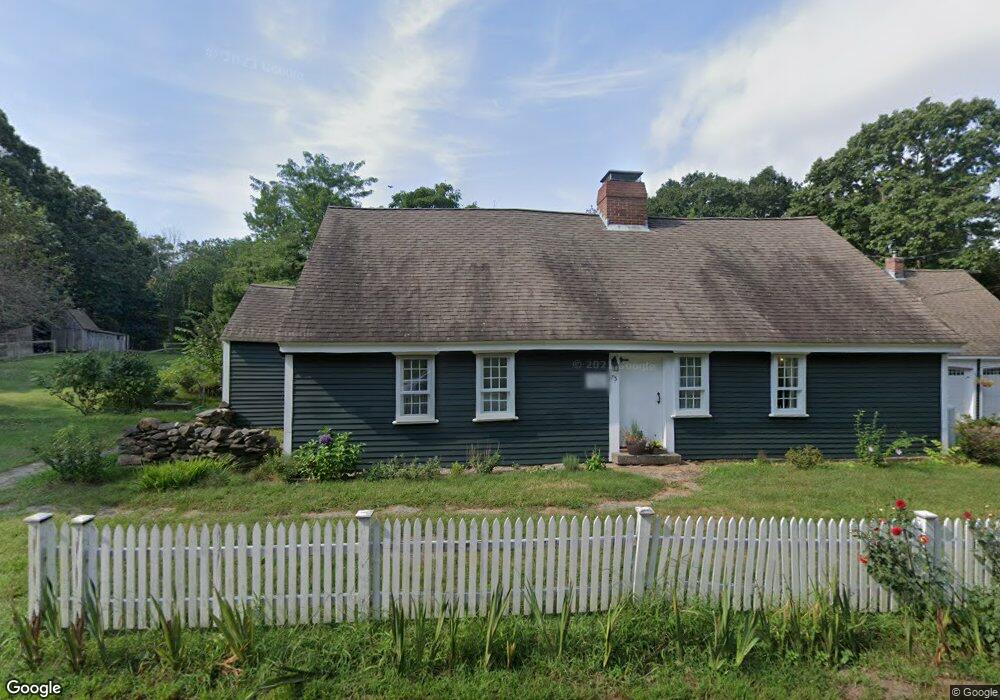
75 Fisher St Medway, MA 02053
Estimated Value: $601,892 - $752,000
3
Beds
2
Baths
1,899
Sq Ft
$345/Sq Ft
Est. Value
About This Home
This home is located at 75 Fisher St, Medway, MA 02053 and is currently estimated at $655,223, approximately $345 per square foot. 75 Fisher St is a home located in Norfolk County with nearby schools including John D. McGovern Elementary School, Burke-Memorial Elementary, and Medway Middle School.
Ownership History
Date
Name
Owned For
Owner Type
Purchase Details
Closed on
Jul 28, 2008
Sold by
Bradbury Donald F and Bradbury Rebecca C P
Bought by
Brooks Paul A
Current Estimated Value
Home Financials for this Owner
Home Financials are based on the most recent Mortgage that was taken out on this home.
Original Mortgage
$242,000
Outstanding Balance
$158,987
Interest Rate
6.35%
Mortgage Type
Purchase Money Mortgage
Estimated Equity
$496,236
Create a Home Valuation Report for This Property
The Home Valuation Report is an in-depth analysis detailing your home's value as well as a comparison with similar homes in the area
Home Values in the Area
Average Home Value in this Area
Purchase History
| Date | Buyer | Sale Price | Title Company |
|---|---|---|---|
| Brooks Paul A | $302,500 | -- |
Source: Public Records
Mortgage History
| Date | Status | Borrower | Loan Amount |
|---|---|---|---|
| Open | Brooks Paul A | $242,000 | |
| Previous Owner | Brooks Paul A | $200,000 |
Source: Public Records
Tax History Compared to Growth
Tax History
| Year | Tax Paid | Tax Assessment Tax Assessment Total Assessment is a certain percentage of the fair market value that is determined by local assessors to be the total taxable value of land and additions on the property. | Land | Improvement |
|---|---|---|---|---|
| 2025 | $7,427 | $521,200 | $309,900 | $211,300 |
| 2024 | $7,505 | $521,200 | $309,900 | $211,300 |
| 2023 | $7,183 | $450,600 | $257,600 | $193,000 |
| 2022 | $7,150 | $422,300 | $229,300 | $193,000 |
| 2021 | $6,694 | $383,400 | $211,900 | $171,500 |
| 2020 | $6,400 | $365,700 | $196,700 | $169,000 |
| 2019 | $6,206 | $365,700 | $196,700 | $169,000 |
| 2018 | $5,973 | $338,200 | $170,500 | $167,700 |
| 2017 | $6,462 | $360,600 | $196,700 | $163,900 |
| 2016 | $6,253 | $345,300 | $181,400 | $163,900 |
| 2015 | $6,211 | $340,500 | $179,200 | $161,300 |
| 2014 | $6,347 | $336,900 | $184,200 | $152,700 |
Source: Public Records
Map
Nearby Homes
- 78 Fisher St
- 85 Fisher St
- 4 Deerfield Rd
- 6 Rainbow Dr
- 22 Granite St
- 9 Tulip Way
- 39 West St
- 15 Broad Acres Farm Rd
- 6 Freedom Trail
- 12 Longmeadow Ln
- 462 Hartford Ave
- 0 Old Log Lane (Farm St) Unit 73416329
- 5 Fales St
- 220 Main St Unit 220
- 455 Hartford Ave
- 56 Paul Rd
- 176 Main St Unit 3
- 387 Hartford Ave
- 11 Black Bear Unit 11
- 9 Black Bear Cir Unit 9