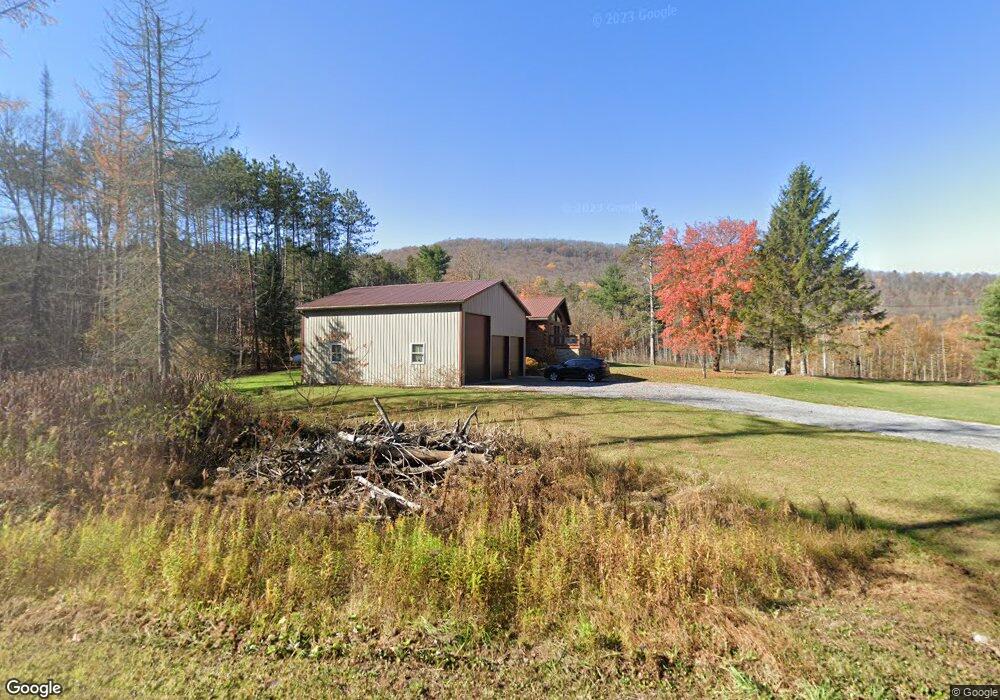
75 Flangian Hill Rd Trout Run, PA 17771
Estimated Value: $412,000 - $441,000
3
Beds
2
Baths
2,030
Sq Ft
$210/Sq Ft
Est. Value
About This Home
This home is located at 75 Flangian Hill Rd, Trout Run, PA 17771 and is currently estimated at $427,001, approximately $210 per square foot. 75 Flangian Hill Rd is a home located in Lycoming County with nearby schools including Montoursville Area Senior High School.
Ownership History
Date
Name
Owned For
Owner Type
Purchase Details
Closed on
Jun 30, 2025
Sold by
Chopick Jason A and Chopick Tiffany T
Bought by
Mcgee Paul and Antonacci Wanita
Current Estimated Value
Home Financials for this Owner
Home Financials are based on the most recent Mortgage that was taken out on this home.
Original Mortgage
$260,000
Outstanding Balance
$258,881
Interest Rate
6.81%
Mortgage Type
New Conventional
Estimated Equity
$168,120
Purchase Details
Closed on
Oct 21, 2015
Sold by
Boob Kelly L
Bought by
Chopick Jason A and Chopick Tiffany T
Home Financials for this Owner
Home Financials are based on the most recent Mortgage that was taken out on this home.
Original Mortgage
$170,000
Interest Rate
3.75%
Mortgage Type
Adjustable Rate Mortgage/ARM
Purchase Details
Closed on
Jan 11, 1989
Sold by
Ebinger John E
Bought by
Boob Kelly L and Boob Nancy M
Create a Home Valuation Report for This Property
The Home Valuation Report is an in-depth analysis detailing your home's value as well as a comparison with similar homes in the area
Home Values in the Area
Average Home Value in this Area
Purchase History
| Date | Buyer | Sale Price | Title Company |
|---|---|---|---|
| Mcgee Paul | $415,500 | None Listed On Document | |
| Mcgee Paul | $415,500 | None Listed On Document | |
| Chopick Jason A | $200,000 | Attorney | |
| Boob Kelly L | $50,000 | -- |
Source: Public Records
Mortgage History
| Date | Status | Borrower | Loan Amount |
|---|---|---|---|
| Open | Mcgee Paul | $260,000 | |
| Closed | Mcgee Paul | $260,000 | |
| Previous Owner | Chopick Jason A | $170,000 |
Source: Public Records
Tax History Compared to Growth
Tax History
| Year | Tax Paid | Tax Assessment Tax Assessment Total Assessment is a certain percentage of the fair market value that is determined by local assessors to be the total taxable value of land and additions on the property. | Land | Improvement |
|---|---|---|---|---|
| 2025 | $3,450 | $139,160 | $18,550 | $120,610 |
| 2024 | $3,351 | $139,160 | $18,550 | $120,610 |
| 2023 | $3,351 | $139,160 | $18,550 | $120,610 |
| 2022 | $3,309 | $139,160 | $18,550 | $120,610 |
| 2021 | $3,309 | $139,160 | $18,550 | $120,610 |
| 2020 | $3,235 | $139,160 | $18,550 | $120,610 |
| 2019 | $3,194 | $139,160 | $18,550 | $120,610 |
| 2018 | $3,117 | $139,160 | $18,550 | $120,610 |
| 2017 | $2,976 | $139,530 | $18,550 | $120,980 |
| 2016 | $2,649 | $128,140 | $18,550 | $109,590 |
| 2015 | $2,649 | $128,140 | $18,550 | $109,590 |
Source: Public Records
Map
Nearby Homes
- 455 Batys Mountain Ln
- 4000 Slacks Run Rd
- 8 Marsh Hill Rd
- 89 Drifty Ln
- 1235 Pleasant Stream Rd
- 70 Greens Hill Rd
- 2176 Wallis Run Rd
- 11068 Route 14 Hwy
- 10784 Pennsylvania 87
- 1485 4 Mile Rd
- 140 Bittner Park Rd Unit 45
- 140 Bittner Park Rd Unit 44
- 12737 Pennsylvania 87
- 1808 Rose Valley Rd
- 5668 Warrensville Rd
- 5384 Warrensville Rd
- 97 Back St
- 582 Mosteller Rd
- 0 Stonington Ct Unit PALY2002080
- 106 Stonington Ct
- 10457 Rose Valley Rd
- 10510 Rose Valley Rd
- 10389 Rose Valley Rd
- 10538 Rose Valley Rd
- 221 Flanagan Hill Rd
- 10758 Rose Valley Rd
- 10771 Rose Valley Rd
- 10790 Rose Valley Rd
- LOT 3 Flanagan Hill Rd
- 10116 Rose Valley Rd
- 11017 Rose Valley Rd
- 11024 Rose Valley Rd
- 11960 Rose Valley Rd
- 702 Flangian Hill Rd
- 11151 Rose Valley Rd
- 598 Flanagan Hill Rd
- 9805 Rose Valley Rd
- 11213 Rose Valley Rd
- 122 Batys Mountain Ln
- 19 White Birch Ln