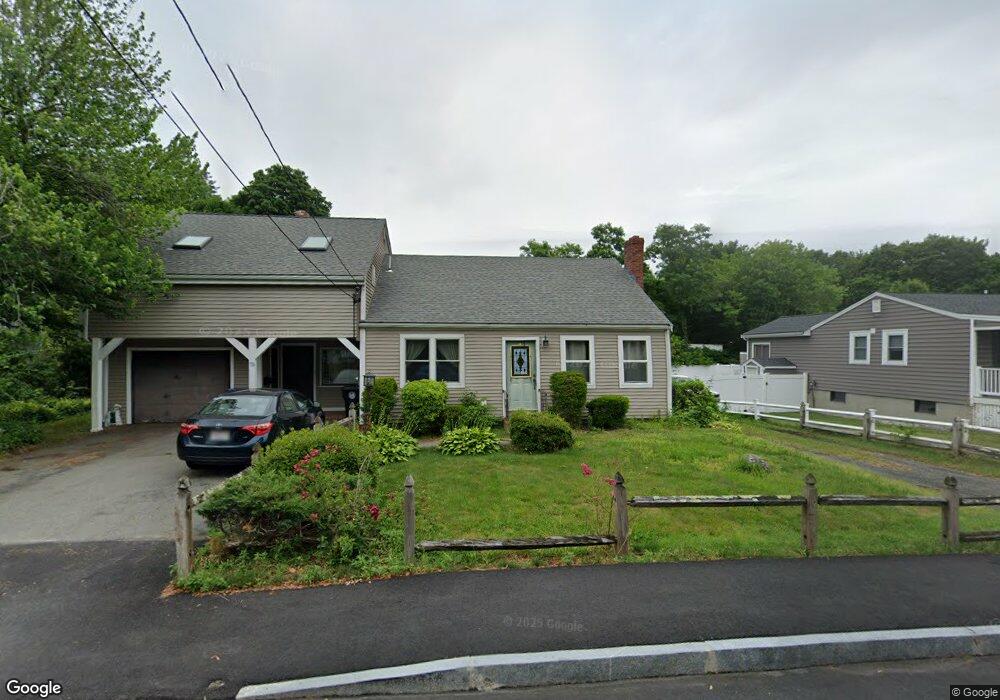
75 Glen St Whitman, MA 02382
Estimated Value: $636,526 - $757,000
4
Beds
3
Baths
3,414
Sq Ft
$209/Sq Ft
Est. Value
About This Home
This home is located at 75 Glen St, Whitman, MA 02382 and is currently estimated at $713,132, approximately $208 per square foot. 75 Glen St is a home located in Plymouth County with nearby schools including St Bridget School.
Ownership History
Date
Name
Owned For
Owner Type
Purchase Details
Closed on
Jul 3, 2003
Sold by
Maccurtain Wanda A and Decross Wanda A
Bought by
Jolliemore William and Jolliemore Susan
Current Estimated Value
Home Financials for this Owner
Home Financials are based on the most recent Mortgage that was taken out on this home.
Original Mortgage
$280,000
Interest Rate
5.46%
Mortgage Type
Purchase Money Mortgage
Create a Home Valuation Report for This Property
The Home Valuation Report is an in-depth analysis detailing your home's value as well as a comparison with similar homes in the area
Home Values in the Area
Average Home Value in this Area
Purchase History
| Date | Buyer | Sale Price | Title Company |
|---|---|---|---|
| Jolliemore William | $360,000 | -- |
Source: Public Records
Mortgage History
| Date | Status | Borrower | Loan Amount |
|---|---|---|---|
| Open | Jolliemore William | $298,381 | |
| Closed | Jolliemore William | $280,000 | |
| Previous Owner | Jolliemore William | $115,000 | |
| Previous Owner | Jolliemore William | $60,000 |
Source: Public Records
Tax History
| Year | Tax Paid | Tax Assessment Tax Assessment Total Assessment is a certain percentage of the fair market value that is determined by local assessors to be the total taxable value of land and additions on the property. | Land | Improvement |
|---|---|---|---|---|
| 2025 | $7,230 | $551,100 | $214,100 | $337,000 |
| 2024 | $6,699 | $525,800 | $210,000 | $315,800 |
| 2023 | $6,343 | $467,400 | $182,100 | $285,300 |
| 2022 | $6,290 | $432,000 | $165,500 | $266,500 |
| 2021 | $6,090 | $392,900 | $152,100 | $240,800 |
| 2020 | $5,879 | $370,900 | $137,600 | $233,300 |
| 2019 | $5,472 | $355,800 | $137,600 | $218,200 |
| 2018 | $5,315 | $332,000 | $130,300 | $201,700 |
| 2017 | $5,007 | $332,000 | $130,300 | $201,700 |
| 2016 | $4,799 | $307,800 | $124,100 | $183,700 |
| 2015 | $4,889 | $313,200 | $124,100 | $189,100 |
Source: Public Records
Map
Nearby Homes
- 95 Temple St
- 42 Rock St
- 150 Harvard St
- 66 Belmont St
- 8 Laurel St
- 48 Day St
- 501 Auburn St Unit 508
- 110 South Ave
- 159 Auburn St
- 157 Auburn St Unit 157
- 147 South Ave
- 154 Auburn St
- 262 Homeland Dr
- 48 Sullivan Terrace
- 603 Temple St
- 300 High St
- 725 Auburn St
- 90 Loring Ave
- 289 Commercial St
- 229 Washington Terrace
Your Personal Tour Guide
Ask me questions while you tour the home.